We are happy to announce a new firmware update for BleuIO Pro, version v1.0.5.6. This release introduces improved control over connection behavior, expanded command functionality, and important stability enhancements to ensure a more reliable development experience.
Below is an overview of what’s new and improved in this firmware update.
New Auto Reconnect Control
One of the key improvements in this release is the ability to enable or disable the auto reconnect feature.
Previously, auto reconnect was always enabled. This meant the dongle would automatically attempt to reconnect to a target device if a disconnect event occurred immediately after connection, specifically with disconnect reason 0x3E (Connection failed to be established).
With firmware v1.0.5.6, users now have full control over this behavior.
New Commands:
ATAR1 – Enable auto reconnect (default)
ATAR0 – Disable auto reconnect
By default, auto reconnect remains enabled to preserve existing behavior, but developers can now turn it off when more precise connection handling is required.
Read-Back Support Added to Multiple Commands
This update adds read functionality to several AT commands that previously allowed configuration changes but did not provide a way to read back their current state.
This enhancement improves transparency and makes it easier to verify configuration during runtime or debugging.
Commands with New Read Support:
ATA
ATAR
ATASPS
ATASSN
ATASSM
ATDS
ATE
ATES
ATEW
ATSIV
ATSRA
ATSAT
AT+FRSSI
AT+SHOWRSSI
With these additions, developers can now query the current settings directly from the dongle, resulting in better control and easier diagnostics.
Stability Improvements
Firmware v1.0.5.6 also includes several internal improvements aimed at making BleuIO Pro more robust and reliable.
Key Enhancements:
Fixed multiple issues that could cause unexpected dongle reboots
Improved internal connection state handling
Enhanced overall firmware stability during connection and disconnection events
These changes help ensure smoother operation, especially in applications with frequent BLE connections.
Firmware v1.0.5.6 for BleuIO Pro introduces several important improvements that enhance both usability and reliability. This release gives developers direct control over the auto reconnect functionality, allowing it to be enabled or disabled based on application needs. It also adds read-back support to many commonly used AT commands, making it easier to verify current settings and improve debugging workflows. In addition, overall stability has been improved through better internal connection state handling and fixes for issues that could previously cause unexpected dongle reboots.
We recommend updating to this latest version to take advantage of the new features and reliability improvements.
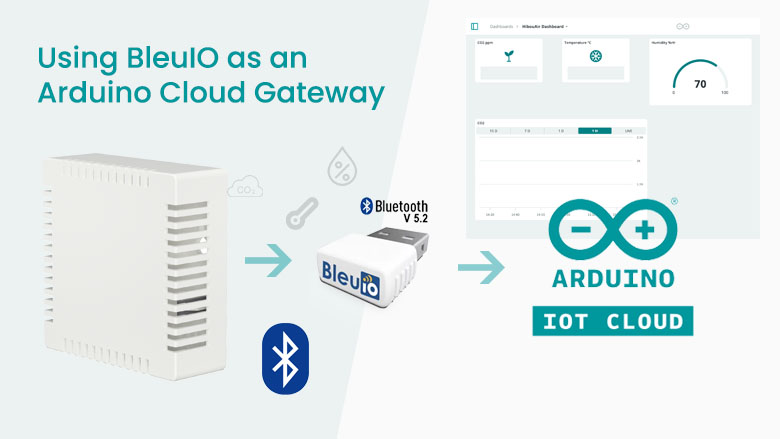
Bluetooth Low Energy (BLE) devices are widely used for environmental monitoring, but getting their data into the cloud often requires complex SDKs, gateways, or proprietary platforms. In this tutorial, we demonstrate a simple and flexible alternative: sending BLE advertisement data directly to Arduino Cloud using BleuIO as a USB BLE gateway.
In this project, we build a lightweight data pipeline where a HibouAir air quality sensor broadcasts environmental data over BLE advertisements, BleuIO scans and captures that data, a Python script decodes the values, and the results are sent straight to Arduino Cloud for storage and visualization — all using free tools.
This project is designed as a showcase example to illustrate how BLE development and cloud integration can be done quickly and transparently, without BLE SDKs or embedded firmware development.
Why Arduino Cloud?
Arduino Cloud offers a convenient and reliable platform for storing and visualizing IoT data without the need to build and maintain a custom backend. Although it is often associated with Arduino hardware, the platform supports Manual Devices, which makes it suitable for gateway-based solutions where data originates from external devices such as BLE sensors. In this project, Arduino Cloud serves as a secure endpoint where decoded air quality data can be published using standard MQTT communication. Its integrated dashboards allow developers to quickly visualize sensor data, making it especially useful for prototyping, demonstrations, and proof-of-concept projects that require minimal setup.
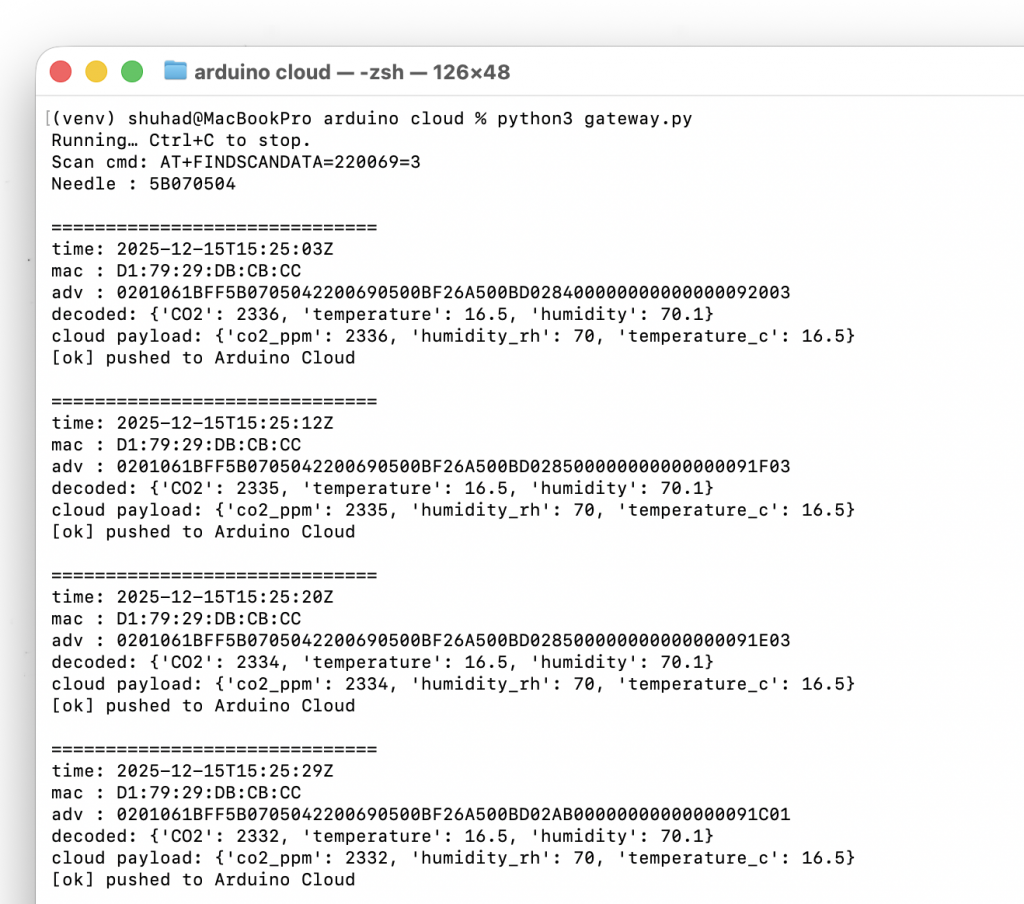
The HibouAir device periodically broadcasts air quality data within its BLE advertisement payload. BleuIO continuously scans for nearby BLE advertisements and filters packets that match a specific device identifier. When a matching advertisement is detected, the Python gateway script extracts the raw data and applies decoding logic to convert the hexadecimal values into human-readable measurements. These decoded values are then published to Arduino Cloud using authenticated MQTT communication. The entire process runs continuously, enabling real-time data updates without establishing a persistent BLE connection to the sensor.
Make sure the serial port matches where BleuIO is connected.
Configure gateway.py
In gateway.py, update the scan command:
SCAN_CMD = "AT+FINDSCANDATA=220069=3"
In this example, 220069 is the HibouAir board ID used in the BLE advertisement. If your HibouAir device uses a different ID, update this value accordingly.
Running the Project
Once the Arduino Cloud configuration and local script setup are complete, running the project requires only a single command.
python3 gateway.py
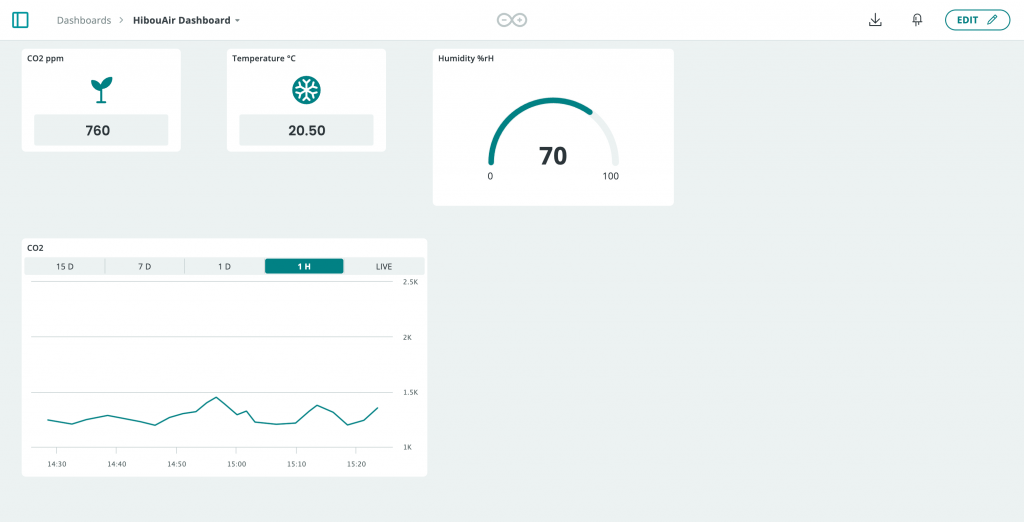
When the gateway script is executed, BleuIO is placed into dual-role mode and begins scanning for BLE advertisements that match the specified HibouAir board identifier. As advertisement packets are received, the script decodes the sensor values and immediately publishes them to Arduino Cloud. Within moments, the dashboard begins displaying live air quality data. This continuous loop allows the system to operate as a real-time BLE-to-cloud gateway with minimal overhead.
Customizing the Dashboard
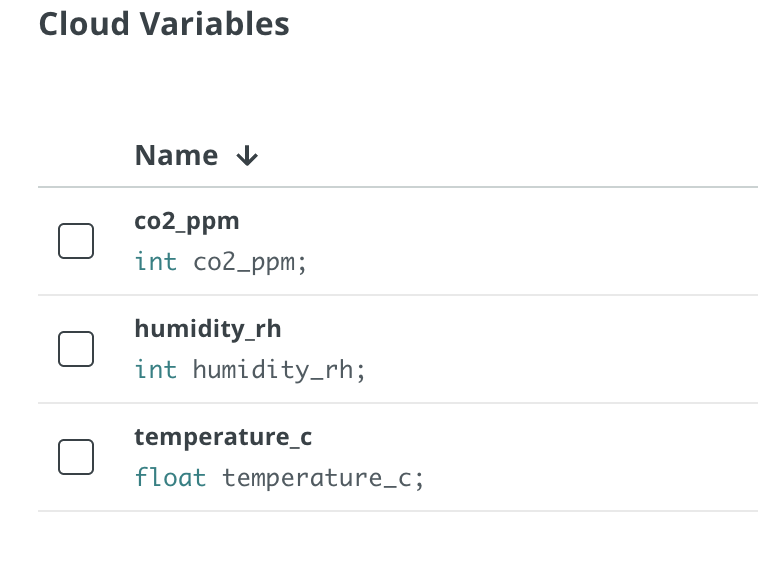
Arduino Cloud dashboards can be customized to present air quality data in a way that best fits the user’s needs. Live values can be displayed using numeric widgets, gauges can be used to visualize ranges such as CO2 concentration or temperature, and chart widgets can be added to show trends over time. By arranging and configuring these widgets, users can create a clear and informative interface for monitoring indoor air quality. This flexibility makes the dashboard suitable not only for development and testing, but also for presentations and live demonstrations.
This project demonstrates how BLE advertisement data can be efficiently captured and delivered to the cloud using a minimal and transparent approach. By combining HibouAir sensors, BleuIO, a simple Python gateway, and Arduino Cloud, it is possible to create a complete end-to-end monitoring solution without relying on complex SDKs or embedded firmware development. While this tutorial focuses on air quality data, the same method can be extended to other BLE-based sensors and cloud platforms. As a showcase example, it highlights the flexibility of BleuIO as a BLE development tool and provides a solid foundation for developers who want to build and expand their own BLE-enabled cloud solutions.
We are pleased to announce the release of firmware v2.7.9.51 for the BleuIO SSD005. This update focuses heavily on improving overall stability and strengthening the firmware’s ability to handle complex Bluetooth Low Energy operations. The result is a smoother, more reliable experience for developers and users working with demanding BLE environments.
Stability Improvements
This version delivers significant enhancements to the firmware’s internal handling of data-intensive operations. As BLE devices continue to grow in complexity, the dongle must process larger amounts of information quickly and without interruption. The new update refines these processes, reducing the risk of unexpected behavior and ensuring that the dongle performs more consistently during everyday use.
Improved Handling of Large Service and Characteristic Discoveries
A key focus of this release was resolving an issue that could cause the dongle to reboot when discovering a large number of services and characteristics. Devices with extensive GATT profiles place additional strain on the system, and the previous firmware could occasionally become overwhelmed. Version 2.7.9.51 addresses this problem by improving how these discoveries are managed, resulting in a far more reliable interaction with complex peripherals.
Strengthened Internal Checks for Scan Results and Notifications
The update also refines several internal validation mechanisms. Earlier versions, under specific conditions, could trigger a sudden reboot while viewing scan results or handling incoming notifications. These checks have now been reinforced, allowing the dongle to operate more securely even when managing rapid or high-volume BLE traffic.
Fixes for Write Operations and Notification Configuration
Two commonly used AT commands received important stability fixes in this release. The AT+GATTCWRITEWRB command, used for write operations, previously encountered rare cases where insufficient validation could lead to an unexpected reboot. Similarly, the command for setting notifications, AT+SETNOTI, has been improved to ensure stable behavior when enabling or adjusting notification settings. These corrections help ensure dependable communication between the dongle and connected devices, particularly in applications that rely heavily on write requests and real-time notifications.
A More Resilient Platform for Developers
Firmware v2.7.9.51 marks another meaningful step toward making the SSD005 dongle a highly dependable tool for BLE development. By addressing edge-case stability issues and strengthening how the dongle handles large or rapidly changing data sets, this update offers a more resilient foundation for both prototyping and production-level applications.
How to Update
The new firmware is available for download on the BleuIO support website. We encourage all users to upgrade to this version to take advantage of the improved stability and robustness it provides.
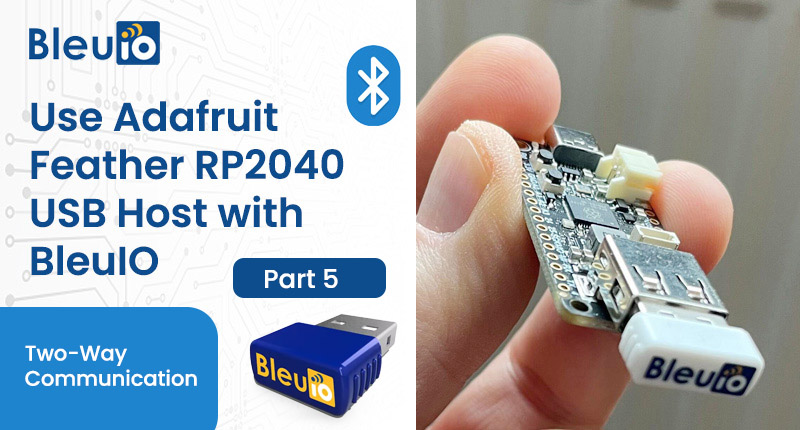
In the earlier parts of this series, we combined the Adafruit Feather RP2040 with the BleuIO USB dongle to build different BLE applications: setting up the RP2040 as a USB host, reading sensor data, advertising measurements and handling secure connections.
In this Part 5, we take the next step and create a simple two-way communication setup. Instead of only broadcasting data, we let a Python script running on your computer talk to the BleuIO dongle connected to the Feather RP2040 and control its LED in real time. At the same time, the Feather responds over the Serial Port Service (SPS), echoing messages back so you can see exactly what was sent on both sides.
This project is a good starting point if you want to remotely control devices, test custom BLE command protocols or build interactive demos using BleuIO and RP2040.
What This Project Does
Arduino project on Adafruit Feather RP2040
On the hardware side, the Adafruit Feather RP2040 is configured as a USB host for the BleuIO dongle, using the same TinyUSB and Pico PIO USB approach as in Part 1 of the series. When the board starts, it initializes the USB host stack, detects the BleuIO dongle and sends a short sequence of AT commands. These commands disable echo, ask the dongle for its own MAC address, set a friendly advertising name (BleuIO Arduino Example) and start BLE advertising. After that, the sketch simply listens for BLE connection events and SPS messages. Depending on what text message it receives over SPS, it either echoes the message back or sends a command to change the LED behaviour on the dongle.
Python script on the computer
On the computer, a Python script acts as the BLE central. It uses the MAC address printed by the Feather’s serial output to connect to the advertising BleuIO dongle. Once connected, it sends text commands over SPS such as ALERT, NORMAL or OFF, and reads back whatever the Feather sends in response. When the Python script sends one of these special words, the Feather generates BLEU AT commands to control the dongle’s LED; for any other text, it just echoes the message. This creates a complete round-trip: you type in Python, the message travels over BLE to the RP2040 and BleuIO, and a response comes back the same way.
Python 3.x and the Python project that connects to BleuIO over SPS
If you already followed Part 1, your RP2040 USB host environment and board configuration should be ready to use.
Source Code on GitHub
You can find the complete source code for this project — both the Arduino sketch and the Python script — in our public GitHub repository: bleuio_arduino_message_transfer_example. Visit the repository at:
Feel free to clone or download the repo to get started quickly. All necessary files — including the .ino, helper headers, and the Python script — are included, so you can replicate the example or adapt it for your own project.
Recap: Preparing the Feather RP2040 as a USB Host
To quickly recap the setup from the earlier article: you install the Raspberry Pi RP2040 board package in the Arduino IDE, select the Feather RP2040 board, and install the Adafruit TinyUSB and Pico PIO USB libraries. You then make sure the CPU speed is set to 120 MHz or 240 MHz, since Pico PIO USB requires a clock that is a multiple of 120 MHz.
Uploading the Arduino Sketch
Open the bleuio_arduino_connect_example.ino and usbh_helper.h in the same Arduino sketch folder.
Select Adafruit Feather RP2040 (or your RP2040 board) under Tools → Board.
Choose the correct COM port for the Feather.
Click Upload.
After upload:
Open Serial Monitor at 9600 baud.
You should see something like:
Connect test v1.0
Core1 setup to run TinyUSB host with pio-usb
SerialHost is connected to a new CDC device. Idx: 0

BleuIO response:
{"own_mac_addr":"xx:xx:xx:xx:xx:xx"}
----
Every 10 seconds (based on ALIVE_TIME) you’ll see an update:
H:M:S - 0:0:10
own_mac_addr: xx:xx:xx:xx:xx:xx
Not connected!
Initially it will say Not connected! because no BLE central is connected yet.
The Python Script (BLE Central)
The Python script acts as a BLE central that connects to the advertising BleuIO dongle and uses the Serial Port Service (SPS).
A typical flow in the Python script is:
Read the MAC address printed by the Arduino Serial Monitor (own_mac_addr).
Use the BleuIO Python library (or BLE stack) to connect to that address.
Once connected, send plain text messages over SPS:
"ALERT"
"NORMAL"
"OFF"
Or any other text.
On the Python side you’ll see:
Connection success message.
Any SPS response sent from the RP2040 (e.g. [RP2040] Alert command Received: [...] or [RP2040] Echo: ...).
And the LED on the BleuIO dongle will react according to the command:
ALERT → Blink pattern (AT+LED=T=100=100).
NORMAL → Toggle LED (AT+LED=T).
OFF → Turn LED off (AT+LED=0).
Any other message → Just an echo, no LED change.
Where to Go Next
This example completes the journey from simple advertising to full two-way communication between a computer application and a BleuIO dongle hosted by an Adafruit Feather RP2040. With this pattern in place, you can replace the LED commands with your own device protocol, combine it with the sensor examples from Part 2 and Part 4, or feed the exchanged messages into larger systems for logging, dashboards or control logic. Because the communication relies on the standard Serial Port Service and BleuIO AT commands, the same structure can be reused for many other projects where a PC, an embedded board and a BLE device need to work together.
Bluetooth Low Energy (BLE) has become a key technology in modern wireless applications—from IoT devices and sensors to wearables, smart tools, and more. While BLE development can traditionally require time, experience, and familiarity with complex protocols, BleuIO dramatically simplifies the process.
BleuIO is a powerful USB BLE dongle designed to help developers of all levels build BLE applications quickly and efficiently. With straightforward AT commands, intuitive documentation, and cross-platform flexibility, it allows users to prototype and develop BLE solutions without the usual learning curve.
But now, with the rapid growth of AI tools such as ChatGPT and Gemini, the development workflow becomes even smoother. AI can help generate ready-to-run scripts, automate coding tasks, and speed up BLE experiments—making the combination of BleuIO + AI incredibly valuable for developers.
Common Challenges in BLE Development
Developing Bluetooth Low Energy applications often requires a solid understanding of BLE protocols and command structures, which can be intimidating for beginners. Developers must also write code that interfaces correctly with hardware such as dongles or embedded devices, and this process can involve repetitive boilerplate code—especially when handling tasks like scanning, connecting, and transferring data. Another common challenge is ensuring that code works consistently across different languages and platforms. These factors can slow down development and create barriers for those who simply want to prototype or test BLE functionality quickly.
How BleuIO and AI Solve These Problems
BleuIO addresses many of these challenges by offering straightforward AT commands that simplify common BLE operations. When paired with modern AI tools, the development process becomes even more efficient. AI systems can read the BleuIO AT Command List and instantly generate complete scripts that integrate these commands correctly, significantly speeding up prototyping. This eliminates the need for manually writing repetitive code, allowing developers to focus on their application rather than the setup. Because BleuIO works seamlessly with Python, JavaScript, C#, Node.js, and many other environments, developers can choose the language they prefer. Even newcomers can get started easily, as AI-generated scripts help bridge any knowledge gaps and provide a smooth entry point into BLE development.
Example: Using ChatGPT and Gemini to Generate a BLE Scan Script
To demonstrate how effectively BleuIO and AI work together, we created a simple test scenario. We began by downloading the BleuIO AT Command List PDF from the Getting Started guide and then asked both ChatGPT and Gemini to generate a Python script that communicates with the BleuIO BLE USB dongle. The script needed to use the correct AT commands, include the appropriate COM port, and perform a scan for nearby BLE devices lasting five seconds. After generating the scripts, we ran them to compare the output produced by the two AI tools.
Video Demonstration
You can watch the full demonstration below, where we walk through the entire process—from downloading the command list to generating and testing the scripts:
This example demonstrates just how powerful the combination of BleuIO and modern AI tools can be. By letting AI generate boilerplate code and BLE scripts, you can focus on building features, testing ideas, or integrating wireless communication into your products.
BleuIO already makes BLE development easy—but with AI, it becomes even more efficient, accessible, and developer-friendly.
We are excited to announce the release of BleuIO Python Library v1.7.2, bringing improved compatibility, new features, and better performance for developers building Bluetooth-enabled applications with BleuIO.
This update supports the latest firmware versions — BleuIO Standard v2.7.9.29 and BleuIO Pro v1.0.4.14 — ensuring seamless integration with the newest hardware capabilities.
Important Note: Python Library v1.7.2 does not support BleuIO Standard firmware 2.2.0 or earlier (SSD005). Please update your dongle to use this library version.
What’s New in v1.7.2
Updated Command Functions
This release introduces expanded support for the latest AT commands shipped with BleuIO Standard v2.7.9.29.
New: ATAR Function
The library now includes a dedicated function for the newly introduced ATAR command, used to enable or disable auto-reconnect:
atar()
This addition offers developers more control over connection stability in dynamic environments.
Enhanced Polling Behavior
Several existing functions have been updated to align with the new status-polling behavior added in firmware v2.7.9.29.
The following command functions now automatically poll status when called without parameters:
ata()
atasps()
atassm()
atassn()
atds()
ate()
atew()
atsiv()
atsra()
atsat()
at_frssi()
at_show_rssi()
This enhancement allows quicker and more intuitive status queries, reducing boilerplate code in your applications.
Improved Logging and Debugging
The library now uses Python’s built-in logging module instead of basic print statements, giving developers much finer control over how information is captured and displayed. This change improves the handling of debug output, warnings, and errors, and allows logging levels to be adjusted to suit different environments. It also enables smoother integration with larger applications that rely on structured logging. Overall, you can now tailor log visibility to match your debugging or production needs more effectively.
New Constructor Parameters
To improve flexibility and performance, three new parameters have been added to the library’s constructor:
w_timeout
Configures the write timeout for the serial port — useful when handling long operations or slower host systems.
exclusive_mode
Optional flag passed to PySerial to request exclusive access to the port. This prevents other processes from interfering with communication.
rx_delay
Enables a short non-blocking sleep time in the RX thread when no bytes are available. This improvement helps avoid busy-looping and reduces CPU load on some platforms.
Smarter RX Thread Behavior
Thanks to the new rx_delay parameter, the receive thread now behaves more efficiently when no incoming data is present. This prevents unnecessary CPU usage while maintaining responsiveness.
Safer Thread and Exit Handling
This release includes more robust exit behavior:
Improved exit_handler
A safer SIGINT (Ctrl+C) handler, even when the library is used outside the main thread
These adjustments help ensure clean shutdowns and reduce the risk of hanging threads in complex applications.
Upgrade Recommended
Updating to Python Library v1.7.2 is quick and straightforward. If you already have a previous version installed, start by upgrading the package through pip. Run the following command in your terminal or development environment:
pip install --upgrade bleuio
This will fetch and install the latest version of the library.
Python Library v1.7.2 is a significant update that enhances functionality, stability, and performance — especially when used with the latest BleuIO firmware versions. We recommend upgrading to take advantage of all new features.
We are excited to announce the release of BleuIO Firmware v2.7.9.29, a significant update focused on improving connection stability, enhancing user control, and expanding the range of readable system states. This release introduces new functionality requested by developers, further strengthens internal reliability, and resolves rare—but important—edge cases in JSON output handling.
With this update, BleuIO becomes more transparent, responsive, and configurable than ever.
What’s New in v2.7.9.29
In previous versions, the auto reconnect function was always active. It automatically attempted to reconnect whenever the dongle received a disconnect event with reason 3E – “Connection failed to be established”.
With v2.7.9.29, developers now have direct control over this behavior through a new command:
ATAR0 – Disable auto reconnect
ATAR1 – Enable auto reconnect (default)
This allows applications to fine-tune how the dongle responds to failed or dropped connections, offering more flexibility across a variety of use cases.
Expanded Readback Functionality
Transparency and configurability are essential for development and debugging. This update introduces read functions for a number of commands that previously could not report their current state.
The following commands now support readback functionality:
ATA
ATAR
ATASPS
ATASSN
ATASSM
ATDS
ATE
ATEW
ATSIV
ATSRA
ATSAT
AT+FRSSI
AT+SHOWRSSI
This enhancement makes it easier to query and verify configuration states during development, which is especially valuable for dynamic or complex applications.
Stability Improvements
This release includes improved handling of internal connection states, resulting in a more robust and reliable operation—particularly in environments where devices frequently connect and disconnect.
Users can expect smoother behavior, fewer edge-case issues, and more predictable Bluetooth communication.
Bug Fixes
Resolved a rare malformed JSON response occurring in verbose mode after executing the AT+GAPCONNECT command. This fix ensures that developers relying on JSON-based parsing and debugging experience consistent and valid output.
Firmware v2.7.9.29 is designed to give developers more control, better insight, and improved reliability. Whether you’re building sophisticated BLE applications or fine-tuning device behavior, this update enhances the overall performance and experience of the BleuIO dongle.
We encourage all users to upgrade to the latest firmware to take advantage of these improvements.
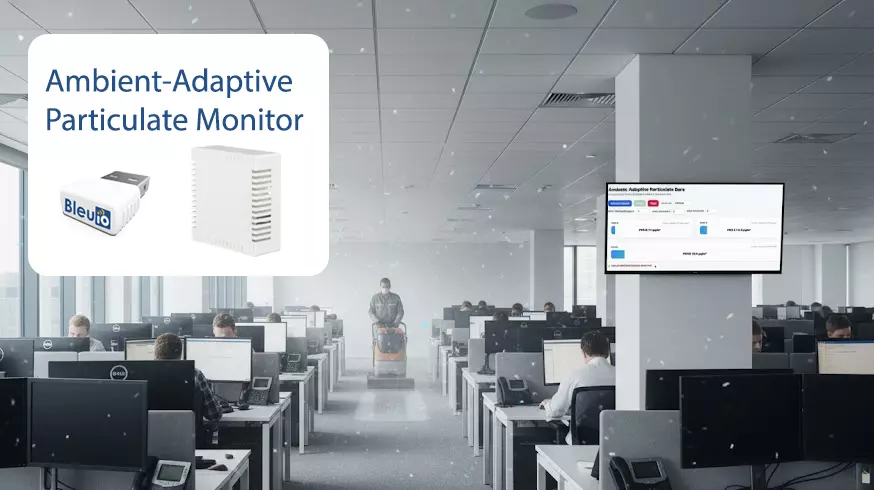
Outdoor air quality is a major focus in Europe in 2025, with tighter standards placing greater emphasis on fine particulate matter—especially PM2.5. Elevated PM levels are linked to asthma, reduced cognitive performance, and increased cardiovascular risk, making reliable monitoring essential. This project demonstrates a simple, browser-based way to visualize PM1.0, PM2.5, and PM10 in real time—supporting better ventilation decisions and aligning with evolving EU air-quality expectations.
What you’ll build
A single HTML file styled with Tailwind CSS that:
Puts BleuIO in a central scanning role
Periodically runs a targeted scan for your HibouAir Board ID
Decodes PM1.0 / PM2.5 / PM10 from the manufacturer data inside BLE advertisements
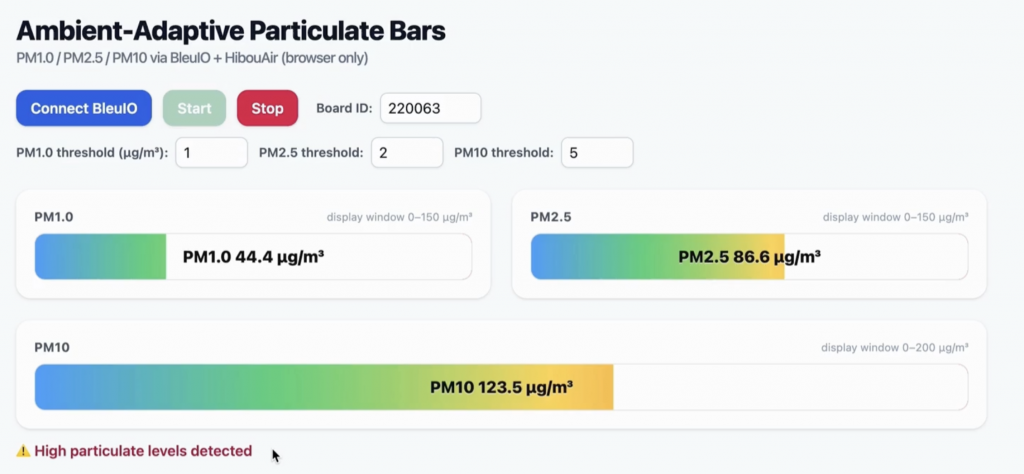
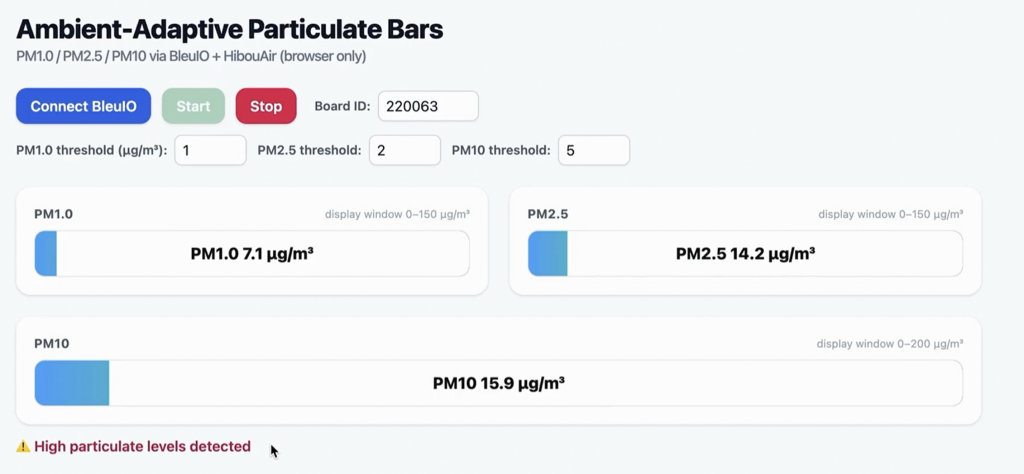
Maps the values to three horizontal bars (default display windows: PM1.0/PM2.5 → 0–150 µg/m³, PM10 → 0–200 µg/m³)
Shows a high particulate banner when any value exceeds your thresholds
HibouAir broadcast short advertisement packets that includes real-time air quality data. We can read them without pairing.
Scan cadence. The dongle sends:
AT+CENTRALonce to enter scanning mode
AT+FINDSCANDATA=<BOARD_ID>=3 every cycle to run a 3-second targeted scan
It reads lines until BleuIO prints SCAN COMPLETE, then waits and repeats
Decoding. HibouAir advertises a compact environmental frame beginning with the marker 5B 07 05. PM values are 16-bit little-endian fields. In this build we anchor to the marker and read:
PM1.0 (raw ÷ 10 → µg/m³)
PM2.5 (raw ÷ 10 → µg/m³)
PM10 (raw ÷ 10 → µg/m³)
UI behavior. Each metric drives a bar that fills left-to-right as the value rises within its display window. Thresholds are configurable (defaults: PM1.0 1, PM2.5 2, PM10 5 µg/m³). If any metric is at or above its threshold, the page shows “High particulate levels detected.”
Customize & extend
You can tailor this monitor to your space and workflow in several practical ways. If you anticipate larger spikes, widen the display windows—for example, expand PM2.5 to 0–200 µg/m³—to keep the bar responsive at higher ranges. For lightweight analytics, append readings to a CSV file or store them in IndexedDB to explore trends over hours or days. If you’re tracking multiple HibouAir units, build a wallboard that scans a list of Board IDs and renders compact tiles for each sensor in a single view. To act on thresholds, add automation hooks that trigger a webhook or drive a fan/relay from a companion script when levels rise. Finally, pair this particulate display with your existing CO₂ or Noise monitors to create a more complete picture of indoor conditions and ventilation effectiveness.
Output
In the video , the session starts at 0.0 µg/m³ across PM1.0/PM2.5/PM10. To demonstrate responsiveness, we briefly spray aerosol near the HibouAir device. Within seconds, the bars respond and the page displays “High particulate levels detected.” After stopping the aerosol and allowing air to clear, values decay back down, the bars recede, and the banner disappears. This sequence illustrates typical behavior you’ll see during quick particulate events (e.g., cleaning sprays, dust disturbances, smoke from cooking) and their recovery.
This project turns HibouAir’s BLE adverts into a clear view of PM1.0, PM2.5, and PM10 using a BleuIO dongle. In minutes, you get live bars, thresholds, and a simple alert that makes particulate spikes obvious. It’s easy to tune—adjust display windows, tweak thresholds, and adapt the layout for different rooms. As EU air-quality expectations tighten, this lightweight monitor helps you spot issues and validate ventilation quickly. From here, you can add data export, multi-device dashboards, or pair it with your CO2 monitor for a fuller picture.
We are excited to release version 1.7.0 of the BleuIO Python library, a significant update focused on performance, stability, and support for the latest dongle firmware features.
This update ensures full compatibility with BleuIO firmware v.2.7.9.11 and BleuIO Pro firmware v.1.0.4.14. It brings substantial improvements to responsiveness and new functions that give developers more control over their Bluetooth Low Energy (BLE) applications.
Key Improvements in v1.7.0
Enhanced Performance and Throughput
Users will immediately benefit from improved responsiveness across the library. We’ve optimized data handling to deliver better throughput, making your BLE interactions faster and more efficient, which is especially valuable for data-intensive applications.
New Security and Command Functions
This release introduces several new functions to match the latest capabilities of the BleuIO firmware:
Auto-Execution Password Commands: We have added at_set_autoexec_pwd, at_enter_autoexec_pwd, and at_clr_autoexec_pwd. These new functions allow you to programmatically set, enter, or clear a password for the auto-execution script, adding a critical layer of security to your device’s startup routine.
ATEW Command Support: Added function for missing command atew . This is used for disabling or enabling the ‘data written’ echo when doing gattcwrite commands.
Stability and Usability Upgrades
To improve the developer experience and overall robustness, v1.7.0 includes several important under-the-hood changes:
Terminal Echo Disabled by Default: To provide a cleaner output and prevent commands from being echoed back, terminal echo is now disabled by default.
Better Event Parsing: We have improved the handling of event and scan result parsing, making the library more reliable and less prone to errors when processing incoming BLE data.
Safer Error Handling: The library now incorporates a safer serial port closing mechanism during exceptions in the reader loop. This ensures better resource management and prevents port-locking issues if an error occurs.
Get the Update
Upgrading to the latest version is simple. You can install or upgrade the package directly from PyPI using pip:
pip install --upgrade bleuio
We are confident that these improvements will help create BLE application with BleuIO and Python a more seamless and powerful experience.
We are pleased to announce a strategic partnership between Smart Sensor Devices AB and Novel Bits, a leading provider of Bluetooth Low Energy (BLE) education and development resources to advance Bluetooth Low Energy (BLE) innovation and expand the reach of BleuIO across the United States.
BleuIO is a powerful and easy-to-use Bluetooth Low Energy USB dongle designed to help developers, educators, and businesses build, test, and integrate BLE applications quickly. With its AT-command interface, cross-platform libraries, and plug-and-play functionality, BleuIO enables rapid prototyping and seamless connectivity — whether you are developing IoT products, smart devices, or wireless data solutions.
Under this collaboration, Novel Bits will leverage BleuIO to develop and showcase BLE-based solutions, demonstrating how BleuIO can serve as a core component in practical, scalable BLE applications. The partnership will focus on creating comprehensive technical resources, tutorials, and real-world applications that demonstrate how BleuIO simplifies Bluetooth development and enables businesses to rapidly integrate wireless connectivity into their products.
Mohammad Afaneh, founder of Novel Bits, has built a career focused on BLE education and developer advocacy. Through Novel Bits, he has created educational content and resources for the Bluetooth Low Energy community. His experience and connection with developers will help demonstrate BleuIO’s capabilities and support its adoption among developers and organizations.
In addition to the collaboration, Novel Bits will also act as an authorized distributor of BleuIO in the United States, providing developers, educators, and organizations with direct access to BleuIO products and integration support.
This partnership reflects our shared vision of making Bluetooth Low Energy technology more accessible, educational, and impactful for the global developer community.