We’re happy to announce the release of BleuIO Firmware v2.7.9.70. This update focuses on improving stability and reliability when scanning and connecting to Bluetooth devices.
We recommend all BleuIO users update to the latest firmware to ensure the best performance and the most reliable Bluetooth Low Energy experience.
What’s New in v2.7.9.70
This release includes important bug fixes that improve device behavior during scanning and connection processes.
Fixed Duplicate Scan Results
In previous firmware versions, there were cases where the same Bluetooth device could appear twice in scan results. This could sometimes make it harder to interpret scan outputs or manage discovered devices.
With v2.7.9.70, this issue has been resolved, ensuring scan results are now displayed correctly and consistently.
Improved MTU Exchange Reliability
Another improvement addresses a situation where the MTU exchange was not always triggered after establishing a connection.
MTU exchange is important because it determines the maximum size of data packets transferred between BLE devices. With this fix, the MTU negotiation process is now reliably triggered during connection, improving data transfer stability.
How to Update Your BleuIO Firmware
You can also follow the firmware update instructions available in our documentation:
This guide walks you through the update process step-by-step.
Stay Updated
Keeping your firmware up to date ensures you benefit from the latest improvements and fixes. We continue working on improving BleuIO and appreciate feedback from our developer community.
If you haven’t already, update your BleuIO device to Firmware v2.7.9.70 today.
Bluetooth Low Energy (BLE) has become one of the most widely used wireless technologies for IoT devices, sensors, wearables, and industrial monitoring systems. Developers working with embedded systems, automation platforms, and hardware integration often rely on C++ because of its performance, low-level hardware access, and portability.
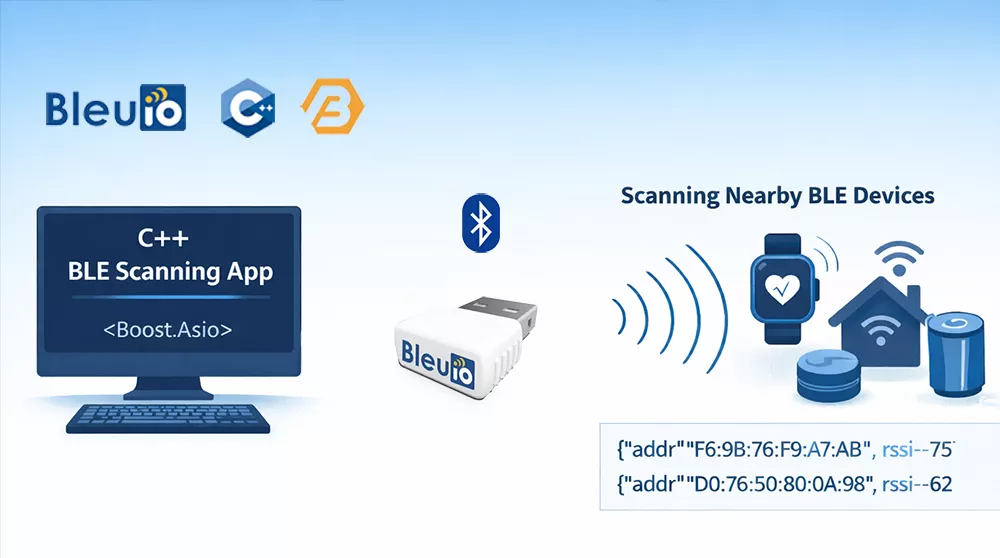
In this tutorial, we will create a simple command-line BLE scanning application using C++. The program connects to the BleuIO USB dongle through a serial port and sends AT commands to control Bluetooth operations. After starting the program, the user enters the number of seconds to scan, and the application instructs the BleuIO dongle to perform a BLE scan and print the detected devices directly in the terminal. This example demonstrates the basic workflow of communicating with BleuIO from a C++ application.
Why C++ and Boost Are Commonly Used for Bluetooth Development
C++ is widely used in Bluetooth and embedded development because it provides high performance and direct access to hardware interfaces such as serial communication. Many IoT gateways, embedded systems, and industrial applications rely on C++ to interact with sensors and wireless devices. To simplify development, developers often use the Boost libraries, which extend the C++ standard library with reliable cross-platform tools. In this tutorial we use Boost.Asio, which provides a portable and efficient way to handle serial communication and asynchronous input/output across different operating systems.
Requirements
Before starting this project, you should have the following:
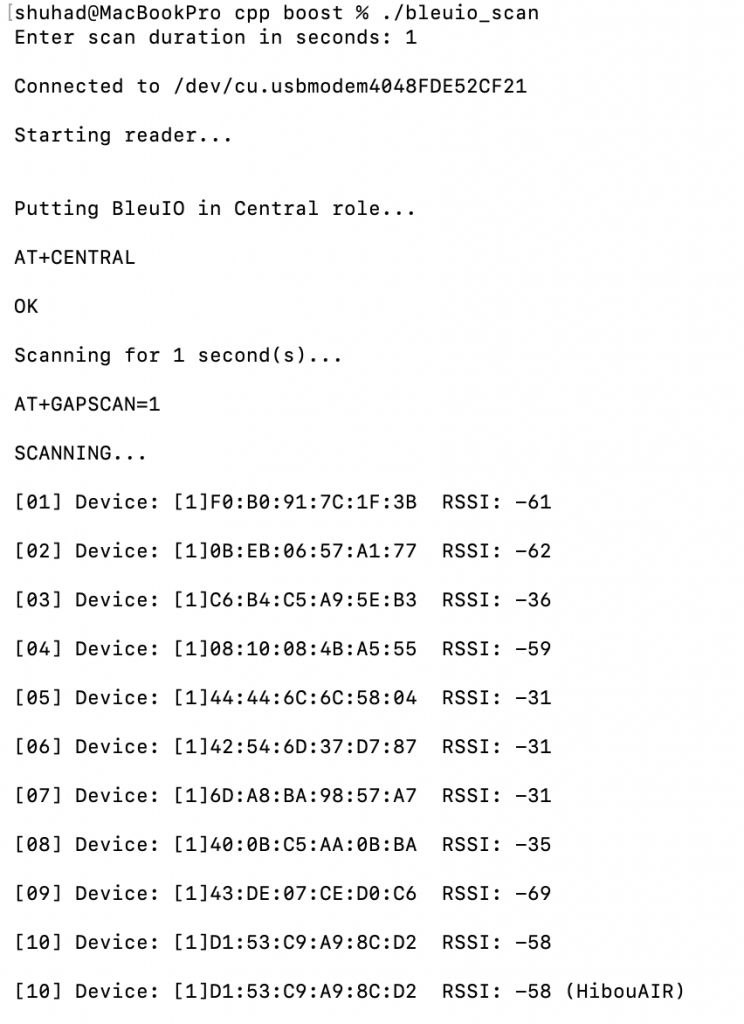
Connect to the BleuIO serial port,Put the dongle into central mode,Start scanning for BLE devices,Print scan results in the terminal
Example output may look like this:
Locating the BleuIO Serial Port
Before running the program, you need to identify the serial port where the BleuIO dongle is connected.
On macOS, you can list available serial devices using the terminal command:
ls /dev/cu.*
The BleuIO device will typically appear with a name similar to:
/dev/cu.usbmodemXXXXXXXX
This value can then be used in the script as the serial port path.
On Windows, the serial port can be identified through Device Manager. After plugging in the BleuIO dongle, open Device Manager and expand the Ports (COM & LPT) section. The device will appear as a USB serial device with a COM port number, such as COM17.
Expanding This Example
The script in this tutorial is a basic example showing how to communicate with the BleuIO dongle using C++ and Boost.Asio. Although it only performs BLE scanning, the same approach can be used to send any AT command supported by BleuIO. Developers can extend this example to connect to devices, read GATT characteristics, parse advertisement data, or integrate BLE functionality into larger applications such as IoT gateways, monitoring tools, or automation systems.
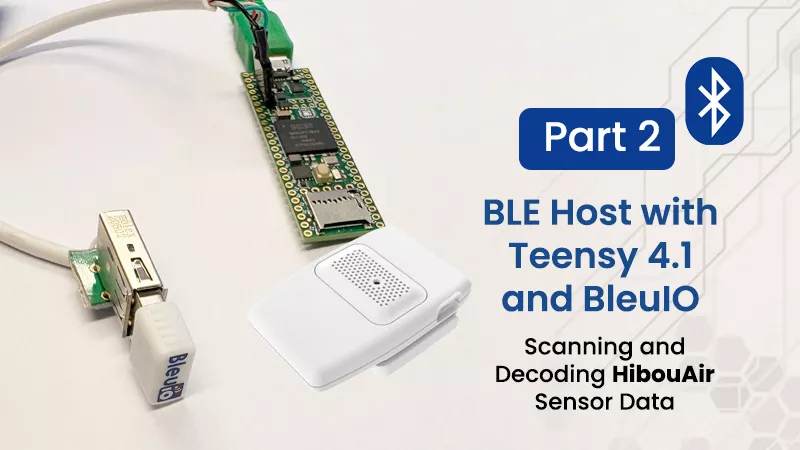
In the previous project, we focused on getting Teensy 4.1 working as a USB Host for the BleuIO. The goal was simple: remove the PC from the equation and prove that a microcontroller could directly control BleuIO and communicate over BLE using AT commands.
This project builds on that foundation and does something practical with it. Instead of manually sending commands and observing responses, we now create a complete scanner that automatically detects nearby HibouAir sensors, reads their BLE advertisement data, decodes it, and prints meaningful environmental values in real time.
At this point, the system stops being a connectivity demo and becomes an actual application.
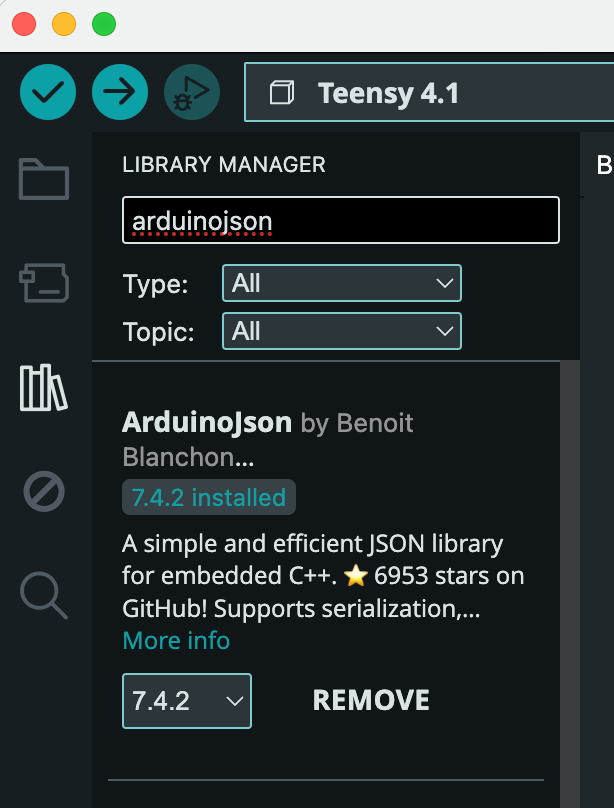
This project uses ArduinoJson to parse scan results from BleuIO.
In Arduino IDE:
Open Library Manager
Search for arduinojson
Install version 7.x or compatible
ArduinoJson is required to deserialize the JSON scan data received from BleuIO.
How it Works
The architecture remains the same as in Part 1, but now it is used with purpose.
Teensy operates in USB Host mode and communicates directly with BleuIO. BleuIO handles all Bluetooth Low Energy scanning internally and outputs scan results as structured JSON strings over USB serial. Teensy receives those strings, parses the JSON content, extracts the manufacturer-specific payload, and decodes it into usable values.
The important thing to notice here is that Teensy never deals with BLE packets directly. There is no radio handling, no GAP or GATT management, and no BLE stack integration. Everything related to Bluetooth stays inside BleuIO. The microcontroller simply receives structured scan results and processes them like any other data stream.
Automatic Startup and Scanning
When the firmware starts, it configures BleuIO automatically. It disables command echo, enables verbose mode, and then sends a filtered scan command:
AT+FINDSCANDATA=FF5B07
This tells BleuIO to report only devices containing the HibouAir manufacturer identifier. From that moment, scan results begin arriving continuously as JSON lines.
Each line contains fields such as the device address and a data field containing the manufacturer payload in hex format. That hex string is where the sensor readings are encoded.
Parsing the JSON Data
Since scan data arrives asynchronously, the project includes a small USB serial line reader. It buffers incoming characters until a newline is detected, ensuring that we always attempt to parse complete JSON messages.
The ArduinoJson library is used to deserialize each line into a JsonDocument. Once deserialized, we check that the expected scan fields are present. If so, we extract the hex-encoded manufacturer payload and pass it to the HibouAir decoder.
At this stage, the data is still raw — just a long hex string representing packed bytes from the BLE advertisement.
Decoding the HibouAir Advertisement Payload
The core of this project is the HibouAir structure. Instead of manually extracting bytes in the main loop, the decoding logic is encapsulated in a dedicated class.
The constructor receives the JSON document, extracts the data field, and interprets the hex string as a packed binary structure. Using offsetof() ensures that the correct byte offsets are used, and helper functions convert the hex pairs into integers. Because the BLE advertisement uses little-endian ordering, some fields require byte swapping before they become meaningful.
Once decoded, the class provides clean accessor functions such as:
getTemp()
getHum()
getBar()
getCo2()
getPM2_5()
These functions already return properly scaled values. For example, temperature is divided by 10 to convert from raw integer format to degrees Celsius.
This separation keeps the application logic simple. The main loop only needs to create a HibouAir object and call show_sensor() to print the values.
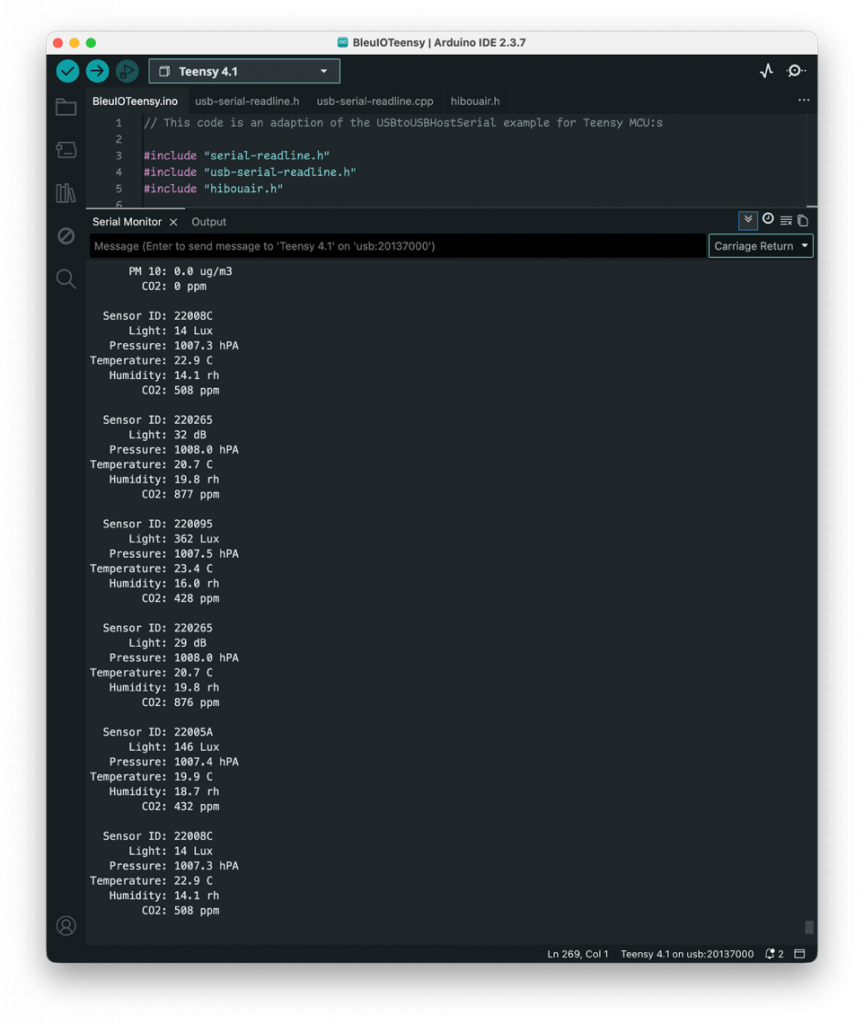
Example Output
When running the project with a nearby HibouAir sensor, the Serial Monitor shows structured environmental readings like this:
This output is generated directly from BLE advertisements without establishing a connection to the sensor. The sensors simply broadcast their measurements, and the system passively collects and decodes them.
GitHub Repository
The complete source code for this project is available here:
You can clone the repository, install the ArduinoJson library through the Arduino IDE Library Manager, upload the sketch to Teensy 4.1, and run it immediately. The code is modular and organized so you can reuse the USB line reader, the HibouAir decoder, or the scanning logic in your own applications.
With this foundation in place, several natural extensions become possible. You could store measurements on an SD card, publish them via MQTT, expose them through a REST interface, or even build a complete air-quality gateway. The BLE side does not need to change.
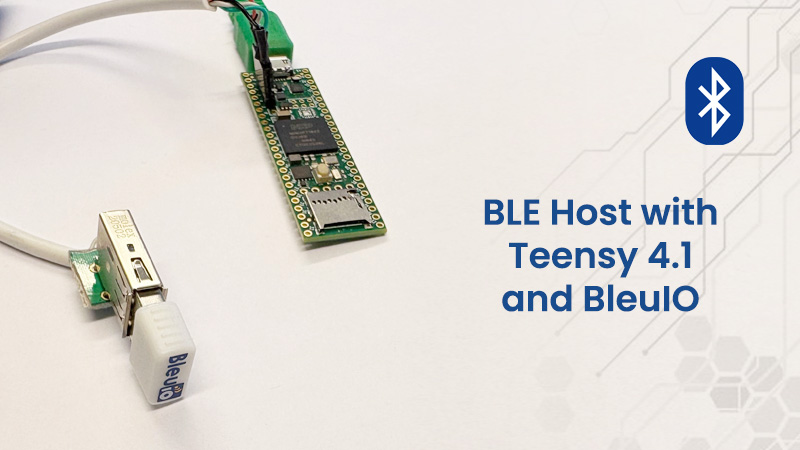
In this project, we will show how to integrate BleuIO with Teensy 4.1 to create Seamless BLE Applications. The goal is to turn the Teensy into a USB Host controller that communicates directly with BleuIO through a simple Arduino sketch, allowing us to create BLE applications without implementing a full BLE stack on the microcontroller.
By the end of this project, you will have a fully functional embedded BLE platform where Teensy 4.1 acts as the application controller and BleuIO handles all Bluetooth Low Energy communication internally. You will be able to send AT commands from Teensy to scan for BLE devices, connect to them, read characteristics, and build your own BLE-based solutions. More importantly, you will gain a reusable architecture that can serve as the foundation for industrial gateways, IoT devices, monitoring systems, or custom embedded products.
Why We Chose Teensy 4.1
The Teensy 4.1 is built around the powerful NXP i.MX RT1062 ARM Cortex-M7 processor running at 600 MHz. This makes it one of the fastest microcontrollers compatible with the Arduino ecosystem. Its high clock speed, large memory capacity, and hardware floating point support allow it to handle complex logic, real-time data processing, and communication tasks with ease.
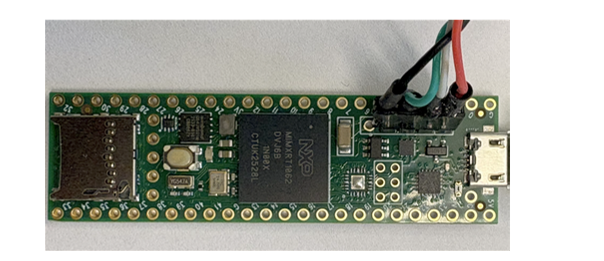
What makes Teensy 4.1 particularly ideal for this project is its USB Host capability. Since BleuIO is a USB device, it requires a host controller to operate independently of a PC. Teensy 4.1 provides exactly that. It allows us to connect BleuIO directly to the microcontroller and build a fully standalone BLE system. The board’s performance headroom ensures stable communication, fast response handling, and scalability for advanced applications.
Rather than choosing a minimal low-power MCU, we selected Teensy 4.1 because it bridges the gap between traditional microcontrollers and more complex application processors. It gives developers flexibility, speed, and reliability in embedded BLE projects.
The system architecture is straightforward. Teensy 4.1 operates as a USB Host and communicates directly with the BleuIO dongle over serial. BleuIO then manages all Bluetooth Low Energy communication with nearby BLE devices. This separation of responsibilities simplifies development significantly. Teensy focuses on application logic, while BleuIO handles the BLE stack internally.
Teensy 4.1 (USB Host)
        ↓
BleuIO USB Dongle
        ↓
BLE Devices
How the Project Works – Step-by-Step
Step 1: Install Arduino IDE and Teensy Support
First download the Arduino 2.x.x IDE from Arduino’s website. All versions 2.0.4 and later are supported. Versions 2.3.0 or later are recommended, due to improvements in Boards Manager.
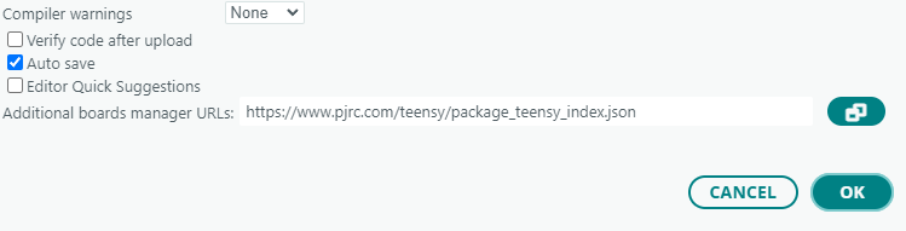
To install Teensy on Arduino IDE 2.x, click File > Preferences (on MacOS, click Arduino IDE > Settings).
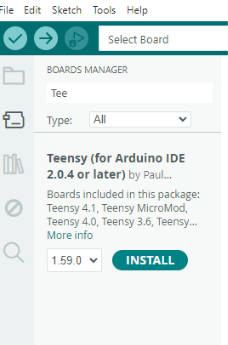
In the main Arduino window, open Boards Manager by clicking the left-side board icon, search for “teensy”, and click “Install”.
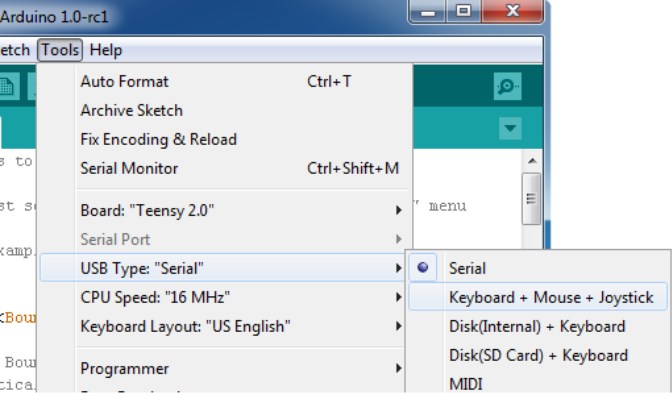
Step 2: Configure USB Type
Teensy supports multiple USB configurations. Under Tools → USB Type, select the appropriate mode so the board can manage serial communication while operating with USB Host functionality. Teensyduino is also compatible with many Arduino libraries.
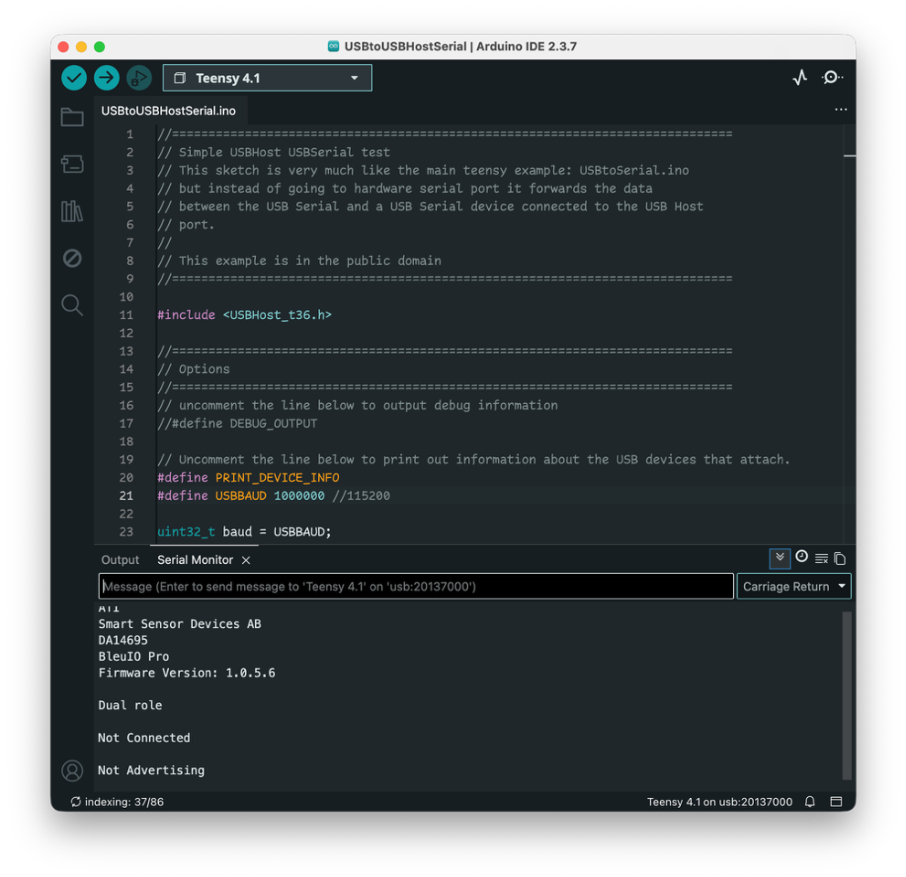
Upload the provided USBtoUSBHostSerial.ino sketch to the Teensy 4.1 using the Arduino IDE. This sketch initializes the USB Host interface and establishes a communication bridge between the Teensy and the BleuIO dongle. Once programmed, the Teensy essentially becomes a serial terminal for BleuIO, allowing you to type AT commands through the Arduino Serial Monitor and receive responses in real time.
Instead of embedding complex BLE logic in the microcontroller firmware, the sketch focuses on maintaining stable USB communication and forwarding user commands to the dongle. BleuIO processes these commands internally and returns structured responses. This design keeps the firmware clean, modular, and easy to expand.
Why This Approach Is Powerful
Developing BLE applications directly on microcontrollers traditionally requires integrating a BLE stack, managing connection states, handling security layers, parsing protocol events, and debugging complex timing issues. This process can be time-consuming and hardware-dependent. Each microcontroller family often requires a different SDK, stack configuration, and maintenance strategy.
By using BleuIO, this complexity is dramatically reduced. BLE functionality is abstracted behind a simple AT command interface. The microcontroller does not need to manage low-level BLE operations. Instead, it communicates using straightforward serial commands while BleuIO takes care of scanning, connecting, reading characteristics, and maintaining protocol compliance internally. This modular architecture makes the system portable across hardware platforms and reduces firmware complexity, development time, and maintenance effort.
GitHub Repository
The source code for this project, USBtoUSBHostSerial.ino sketch, is publicly available on GitHub:
This project is shared as a public example to demonstrate how BleuIO can be integrated into high-performance embedded systems. It is intentionally simple in structure so that developers can clearly understand the architecture and reuse it in their own applications.
By combining the computational power of Teensy 4.1 with the modular BLE capabilities of BleuIO, we created a clean and scalable embedded architecture. This project highlights how BLE integration does not need to be complicated. With the right approach, developers can focus on innovation and application logic rather than low-level protocol management.
Bluetooth Low Energy is often associated with mobile apps, embedded firmware, or cloud gateways. In practice, however, BLE is equally powerful on the desktop. With the right tools, a desktop application can scan, decode, and visualize BLE sensor data in real time—without relying on browsers or mobile platforms.
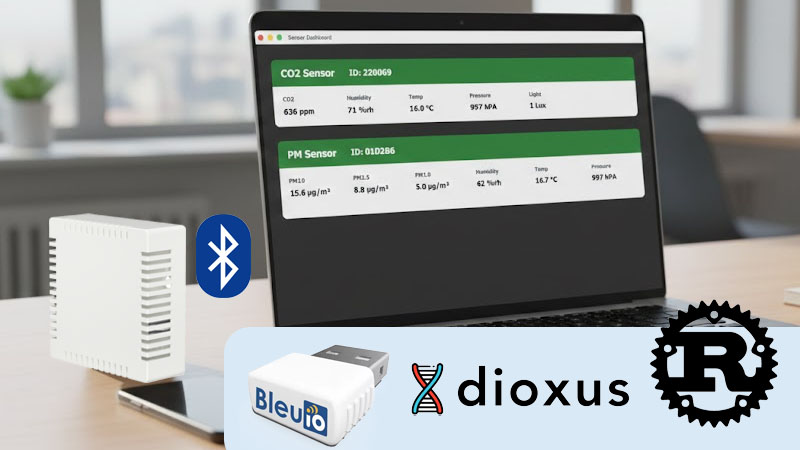
In this tutorial, we demonstrate how BleuIO can be used as a flexible BLE interface for desktop applications written in Rust, using the Dioxus framework. The result is a native desktop application that scans nearby HibouAir sensors, decodes their BLE advertisement data, and presents air-quality metrics in a clean, responsive user interface.
This project is intended as a practical example that shows how BleuIO fits naturally into modern desktop development workflows—regardless of programming language.
What We Are Building
The application is a native desktop air-quality dashboard. It connects to a BleuIO USB dongle over a serial port, puts the dongle into BLE scanning mode, and continuously listens for BLE advertisements from nearby HibouAir sensors. These advertisements contain manufacturer-specific data with environmental measurements such as CO2 concentration, particulate matter, temperature, humidity, pressure, VOC levels, and ambient light.
The desktop application decodes this data locally and displays it in real time. Each detected sensor is shown as its own panel, with a clear header identifying the device type and a structured content area showing the latest measurements.
The entire solution runs locally on the user’s computer. There is no cloud dependency, no browser runtime, and no mobile device involved.
Why Rust and Dioxus?
Rust has become increasingly popular for system-level and desktop applications because it combines performance, memory safety, and strong tooling. For BLE applications that involve continuous serial communication and real-time data processing, these properties are particularly valuable.
Dioxus is a Rust UI framework inspired by modern component-based design. It allows developers to build native desktop interfaces using a declarative approach while still compiling to a true desktop binary. In this project, Dioxus is used to render the dashboard, manage state updates as sensor data arrives, and keep the UI responsive even during continuous BLE scanning.
The combination of Rust, Dioxus, and BleuIO demonstrates that desktop BLE applications do not need to rely on platform-specific SDKs or heavyweight frameworks.
Requirements
To run this project, the following hardware and software are required:
A supported desktop operating system (macOS, Linux, or Windows)
No proprietary SDKs or BLE drivers are required. BleuIO communicates using standard AT commands over a serial interface, making the setup lightweight and portable.
How the Project Works Internally
When the application starts, it first searches for a connected BleuIO dongle by scanning available serial ports and matching the dongle’s USB vendor and product IDs. Once the correct device is found, the application opens the serial port and initializes the dongle by disabling command echo and enabling verbose mode.
After initialization, the application instructs BleuIO to start scanning for BLE advertisements that match HibouAir’s manufacturer identifier. BleuIO then streams scan results back to the application as JSON-formatted lines over the serial connection.
Each incoming scan packet is parsed and inspected. The application locates the BLE manufacturer-specific data, verifies that it belongs to HibouAir, and decodes the payload into a structured Rust data type. To ensure stable and predictable readings, only the full advertisement format used by HibouAir beacon type 0x05 is processed. Partial or auxiliary beacon formats are ignored in this example project.
Decoded sensor data is stored in memory and immediately reflected in the user interface. As new advertisements arrive, the corresponding sensor panel updates automatically.
Project Structure
The source code is organized into clear, functional modules. UI components are separated from BLE logic and data models, making the project easy to understand and extend. The main application entry point configures the desktop window and mounts the dashboard component. BLE communication is encapsulated in a dedicated hook that runs asynchronously and feeds decoded sensor data into the UI layer.
This structure mirrors how larger Rust desktop applications are typically organized, and it provides a solid foundation for adding features such as data logging, historical charts, filtering, or export functionality.
Source Code and How to Run the Project
The complete source code for this project is publicly available on GitHub:
After cloning the repository, the application can be run in development mode using the Dioxus CLI. This launches the desktop window and enables hot reloading, which is useful when experimenting with UI changes or decoding logic. The project can also be built and run using standard Cargo commands, producing a native desktop binary.
Because the code is open and self-contained, developers are free to study it, modify it, or reuse parts of it in their own BLE-based desktop applications.
The complete instruction on how to run this project is available on the Readme file.
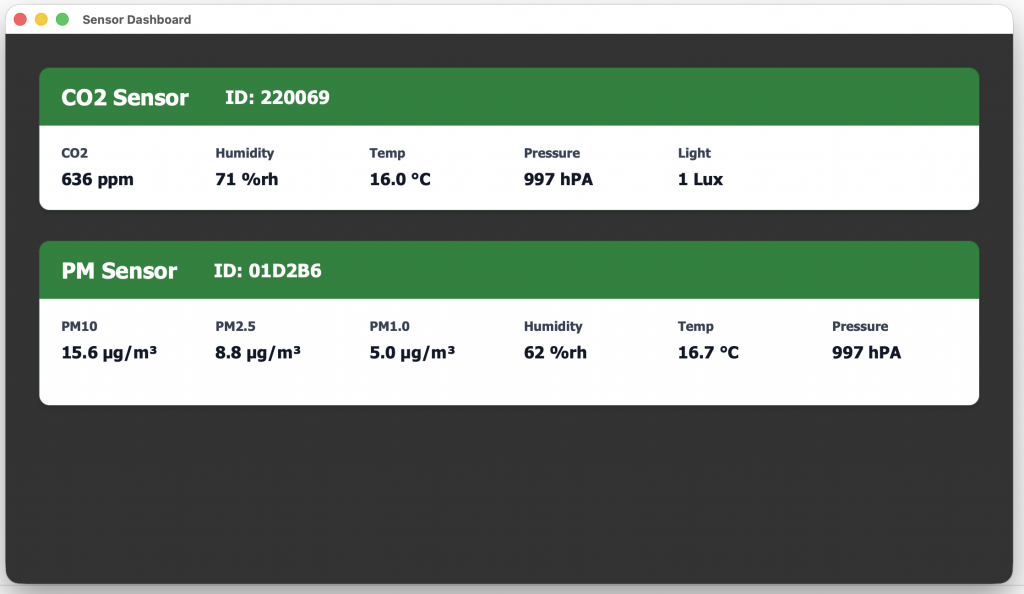
Application Output
When running, the application displays a dashboard with one panel per detected HibouAir sensor. Each panel includes a colored header identifying the sensor type, followed by a white content area showing live air-quality measurements. Values update continuously as new BLE advertisements are received, providing an immediate view of the surrounding environment.
A screenshot of the running application is shown below to illustrate the final result.
This project is intentionally kept simple. It is not a finished product, but rather an educational example that demonstrates how BleuIO can be used with Rust and Dioxus to build a native desktop BLE application. The source code is public, easy to follow, and designed to be extended.
At BleuIO, our goal has always been to make Bluetooth Low Energy (BLE) development, testing, and prototyping as smooth and accessible as possible. Many of our users are already familiar with how easy it is to purchase and start working with BleuIO dongles directly from our website.
Now, we are excited to take this one step further.
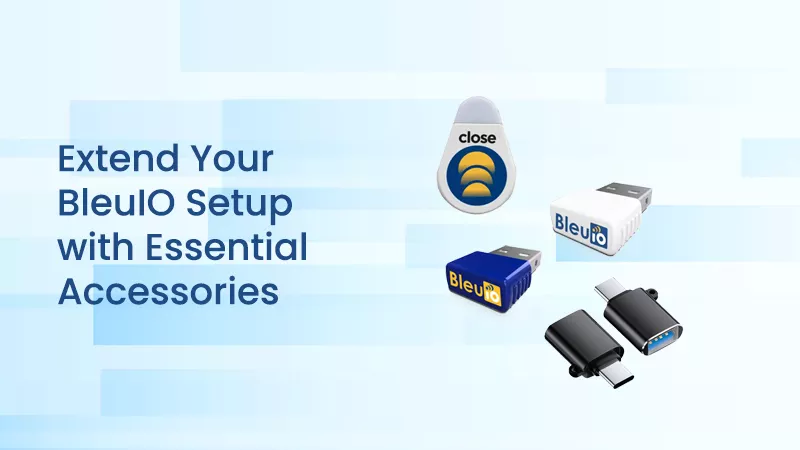
In addition to BleuIO dongles, you can now also purchase Close Beacon and a USB Type-C adapter directly from our store. These additions are designed to complement BleuIO perfectly and support developers working with modern hardware and real-world BLE use cases.
BleuIO has become a trusted choice for developers working with Bluetooth Low Energy. Its simplicity, stability, and flexibility make it suitable for everything from early prototyping to advanced testing and validation. Developers rely on BleuIO to scan, monitor, and interact with BLE devices during development, helping them better understand signal behavior, performance, and communication reliability.
By extending our product offering, we aim to support not only the core BLE interface but also the surrounding tools developers need for efficient workflows and realistic testing.
Close Beacon
Close Beacon is a Bluetooth device that continuously transmits its unique identity, making it especially valuable for developers working with beacon-based applications. When used alongside BleuIO, Close Beacon enables realistic testing of proximity detection, presence awareness, and location-based interactions. Combined with BleuIO, Close Beacon provides a practical way to simulate real-world beacon deployments during development and validation.
USB Type-C Adapter
As laptops and workstations continue to evolve, many modern devices now rely exclusively on USB Type-C ports. This shift can introduce challenges when working with traditional USB-based development tools. To address this, we now offer a USB Type-C adapter that ensures smooth connectivity between BleuIO and newer computers.
The adapter allows developers to connect BleuIO without additional configuration, maintaining a simple and efficient workflow. Whether working in an office, lab, or remote environment, the adapter ensures that BleuIO remains compatible with the latest hardware platforms and development setups.
With the addition of Close Beacon and the USB Type-C adapter, the BleuIO store now offers more than just a BLE dongle. Developers can assemble a complete toolkit for Bluetooth Low Energy development, testing, and experimentation directly from our website.
We are pleased to announce the release of BleuIO Python library v1.7.4, a stability-focused update that improves logging clarity and, most importantly, significantly enhances how applications recover from unexpected dongle disconnections.
This release is designed to make long-running Python applications more reliable when working with BleuIO dongles in real-world environments.
Compatibility
Python library v1.7.4 is tested and verified with the following firmware versions:
BleuIO Standard: v2.7.9.51 or later
BleuIO Pro: v1.0.5.6
Note: This library version does not support firmware 2.2.0 or earlier on BleuIO Standard (SSD005).
What’s New in v1.7.4
This release introduces a refinement to the logging system used by the Python library. Previously, many internal messages were logged at the INFO level, which could result in excessive output in production environments. In version 1.7.4, all such messages have been moved to the DEBUG level, except for the firmware version message, which remains at the INFO level. This change provides a cleaner default log output while still allowing developers to access detailed diagnostic information when debug logging is enabled.
Reliable Recovery After Dongle Disconnection
The most significant improvement in Python library v1.7.4 is a fix for an issue related to recovering from lost communication with the BleuIO dongle. In earlier versions, the library could encounter problems if the dongle was unplugged, reset using the ATR command, or disconnected due to a crash or system error. In such cases, applications often required a full restart to regain communication.
This issue has now been resolved. When communication with the dongle is lost, the library raises a clear and consistent exception, BleuIOException: Port to BleuIO is not open. This allows applications to detect the failure immediately and implement recovery logic without terminating the program.
Exception Handling and Reconnection Example
With the improved error handling in this release, developers can catch the exception raised when the port is no longer available and reinitialize the BleuIO object to restore communication. The example below demonstrates how an application can continuously query the dongle, detect a disconnection, and automatically reconnect once the dongle becomes available again.
from bleuio_lib.bleuio_funcs import BleuIO
import time


my_dongle = BleuIO()
dongle_connected = True
while 1:
    try:
        print(my_dongle.ati().Rsp)
        time.sleep(2)
    except Exception as e:
        if "Port to BleuIO is not open!" in str(e):
            print("Error communicating with dongle: ", e)
            dongle_connected = False
            while not dongle_connected:
                try:
                    my_dongle = BleuIO()
                    dongle_connected = True
                    print("Reconnected to dongle")
                except Exception as e:
                    print("Reconnection failed: ", e)
                    time.sleep(2)
                    pass
Example Output
[{'R': 7, 'dev': 'Smart Sensor Devices', 'hw': 'DA14683 (P25Q80LE)', 'name': 'BleuIO'}, {'R': 7, 'fwVer': '2.7.9.55', 'gap_role': 'dual'}, {'R': 7, 'connected': False, 'advertising': False}]
[{'R': 8, 'dev': 'Smart Sensor Devices', 'hw': 'DA14683 (P25Q80LE)', 'name': 'BleuIO'}, {'R': 8, 'fwVer': '2.7.9.55', 'gap_role': 'dual'}, {'R': 8, 'connected': False, 'advertising': False}]
Error processing serial data: ClearCommError failed (OSError(22, 'The I/O operation has been aborted because of either a thread exit or an application request.', None, 995))   <------------- When I pulled out dongle and plugged it in again
Traceback (most recent call last):
  File "C:\Users\emil\AppData\Roaming\Python\Python38\site-packages\bleuio_lib\bleuio_funcs.py", line 387, in __poll_serial
    self.rx_buffer += get_data()
  File "C:\Users\emil\AppData\Roaming\Python\Python38\site-packages\serial\serialutil.py", line 652, in read_all
    return self.read(self.in_waiting)
  File "C:\Users\emil\AppData\Roaming\Python\Python38\site-packages\serial\serialwin32.py", line 259, in in_waiting
    raise SerialException("ClearCommError failed ({!r})".format(ctypes.WinError()))
serial.serialutil.SerialException: ClearCommError failed (OSError(22, 'The I/O operation has been aborted because of either a thread exit or an application request.', None, 995))
Serial exception in polling thread: ClearCommError failed (OSError(22, 'The I/O operation has been aborted because of either a thread exit or an application request.', None, 995))
Traceback (most recent call last):
  File "C:\Users\emil\AppData\Roaming\Python\Python38\site-packages\bleuio_lib\bleuio_funcs.py", line 387, in __poll_serial
    self.rx_buffer += get_data()
  File "C:\Users\emil\AppData\Roaming\Python\Python38\site-packages\serial\serialutil.py", line 652, in read_all
    return self.read(self.in_waiting)
  File "C:\Users\emil\AppData\Roaming\Python\Python38\site-packages\serial\serialwin32.py", line 259, in in_waiting
    raise SerialException("ClearCommError failed ({!r})".format(ctypes.WinError()))
serial.serialutil.SerialException: ClearCommError failed (OSError(22, 'The I/O operation has been aborted because of either a thread exit or an application request.', None, 995))
Error communicating with dongle:  Port to BleuIO is not open!  <-------------  Here I catch the exception and handle it
No BleuIO dongle COM port available!
Reconnection failed:  No BleuIO dongle COM port available!
No BleuIO dongle COM port available!
Reconnection failed:  No BleuIO dongle COM port available!
No BleuIO dongle COM port available!
Reconnection failed:  No BleuIO dongle COM port available!
Reconnected to dongle  <----------------------- Bootloader exits and the BleuIO COM port is available
[{'R': 2, 'dev': 'Smart Sensor Devices', 'hw': 'DA14683 (P25Q80LE)', 'name': 'BleuIO'}, {'R': 2, 'fwVer': '2.7.9.55', 'gap_role': 'dual'}, {'R': 2, 'connected': False, 'advertising': False}]
[{'R': 3, 'dev': 'Smart Sensor Devices', 'hw': 'DA14683 (P25Q80LE)', 'name': 'BleuIO'}, {'R': 3, 'fwVer': '2.7.9.55', 'gap_role': 'dual'}, {'R': 3, 'connected': False, 'advertising': False}]
With this approach, your application can continue operating seamlessly even after unexpected interruptions.
Upgrade Recommended
Updating to Python Library v1.7.4 is quick and straightforward. If you already have a previous version installed, start by upgrading the package through pip. Run the following command in your terminal or development environment:
pip install --upgrade bleuio
This will fetch and install the latest version of the library.
Python library v1.7.4 is a reliability-driven update that delivers cleaner logging and robust recovery from connection loss. These improvements make BleuIO-based Python applications more stable, easier to maintain, and better suited for continuous and production-level use. We strongly recommend this update for all developers working with BleuIO in Python.
Bluetooth Low Energy can be challenging to learn and work with, especially when traditional development kits require complex SDKs, toolchains, and embedded firmware before you ever see your first result. BleuIO was created to remove that friction by allowing developers to interact with Bluetooth LE using simple, platform-independent AT commands. Through our collaboration with Novel Bits, learning and working with BleuIO is now even more accessible with practical educational resources, and faster access for U.S. customers, while continuing to support developers worldwide.
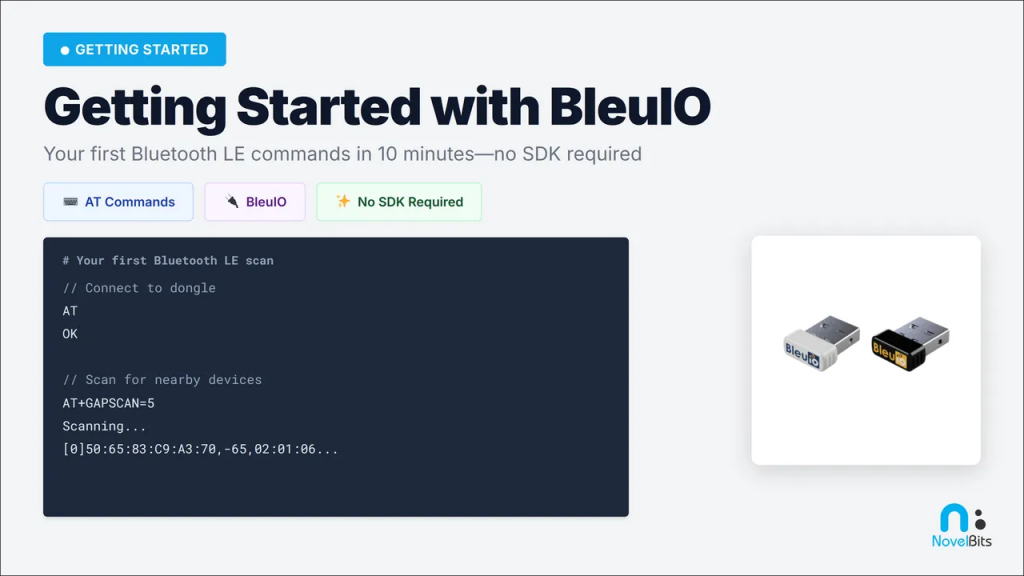
Getting Started with BleuIO: A Practical Guide
As part of this collaboration, Novel Bits has published a detailed “Getting Started with BleuIO” guide designed to help developers get up and running in minutes. The guide walks through connecting the dongle, issuing your first AT commands, scanning for nearby Bluetooth LE devices, and understanding advertising data-all without SDKs, embedded C, or complex toolchains.
The focus is on learning how Bluetooth LE actually works, using real hardware and clear, step-by-step explanations.
From First Commands to Advanced BLE Skills
For developers who want to go further, Novel Bits has also introduced a comprehensive hands-on course built around BleuIO hardware: Bluetooth LE Unplugged. The course takes a practical, hardware-first approach to learning BLE, allowing participants to explore both central and peripheral roles using two BleuIO dongles.
Rather than focusing on vendor-specific SDKs, the course emphasizes transferable Bluetooth LE knowledge that applies across platforms and products. Topics range from advertising and GATT fundamentals to security, automation, and packet-level analysis.
BleuIO Now Available with Fast U.S. Shipping Through Novel Bits
BleuIO continues to be available to developers and organizations worldwide through our global distribution channels. To better support customers in the United States, we’re pleased to share that BleuIO can now also be ordered directly from the U.S. via our authorized partner, Novel Bits. For U.S. customers, this means quick delivery, predictable shipping, and a smoother purchasing experience.
Whether you’re prototyping a new idea, testing devices at scale, or building a commercial product, BleuIO combined with Novel Bits’ educational resources gives you a fast and practical path forward.
Bluetooth Low Energy development traditionally involves installing serial terminal software, configuring ports, memorizing AT commands, and constantly switching between tools and documentation. While this approach works, it often slows down development and adds unnecessary complexity, especially during early testing and prototyping.
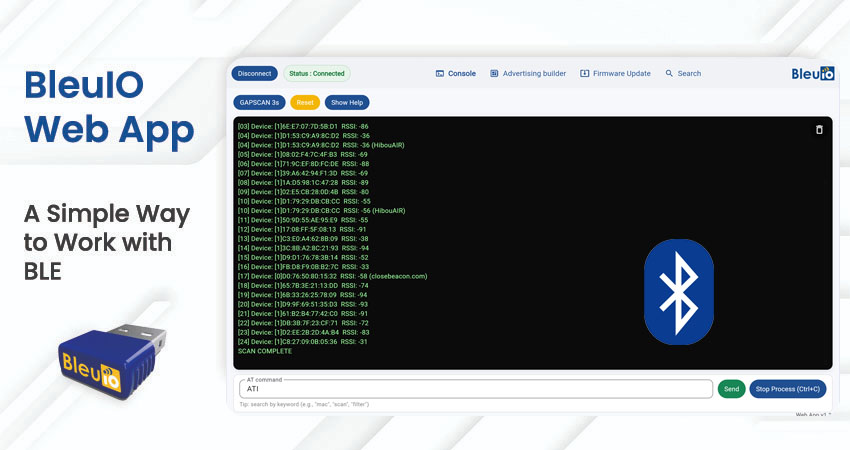
The BleuIO Web App was created to simplify this workflow. It provides a browser-based interface that allows developers to work directly with BleuIO and BleuIO Pro dongles without installing any software. By moving the entire workflow to the web, the app removes friction and makes BLE development more accessible and efficient.
No Installation. No Drivers. No Terminal Software.
One of the key strengths of the BleuIO app is that it runs entirely in the browser. There is no need to install serial terminal tools like Tera Term, Minicom, or Screen, and there is no platform-specific setup required. Developers can simply plug the BleuIO dongle into their computer, open the web app, and start interacting with the device immediately.
This plug-and-play approach makes the app ideal for quick testing, demonstrations, workshops, and development environments where speed and simplicity are important. It also ensures a consistent experience across operating systems, as everything is handled directly through the browser.
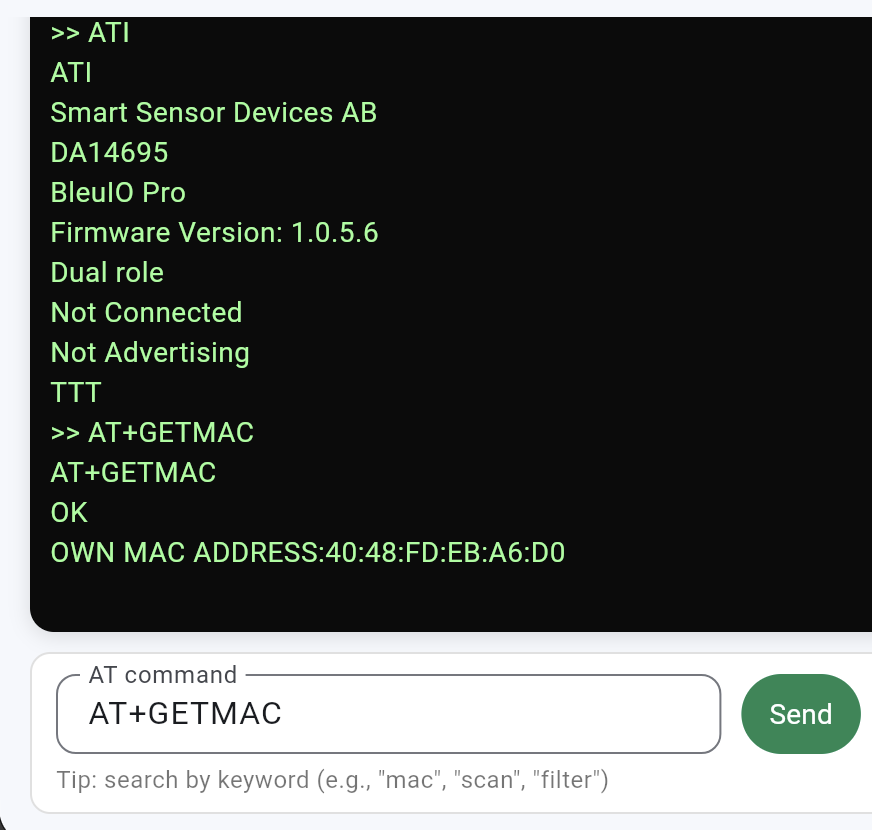
As soon as a BleuIO device is connected, the app clearly displays the connection status. This immediate feedback removes uncertainty and ensures developers always know when the dongle is ready to receive commands.
The integrated terminal shows responses in real time, allowing developers to observe scan results, device information, and command feedback as it happens. This direct visibility helps speed up debugging and makes it easier to understand how the device behaves during different operations.
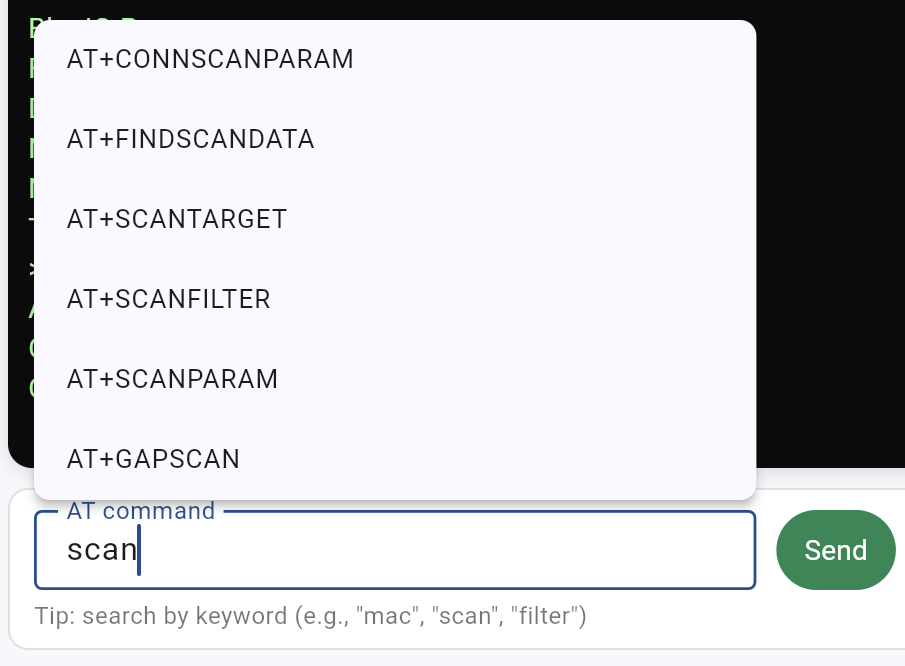
Smart AT Command Input with Built-In Discovery
The BleuIO app removes the need to memorize AT commands by providing intelligent command suggestions. As developers begin typing a keyword, relevant commands appear instantly, making discovery fast and intuitive.
This approach is especially helpful when working with a large command set or when learning the platform for the first time. It allows developers to focus on what they want to achieve rather than recalling exact command names.
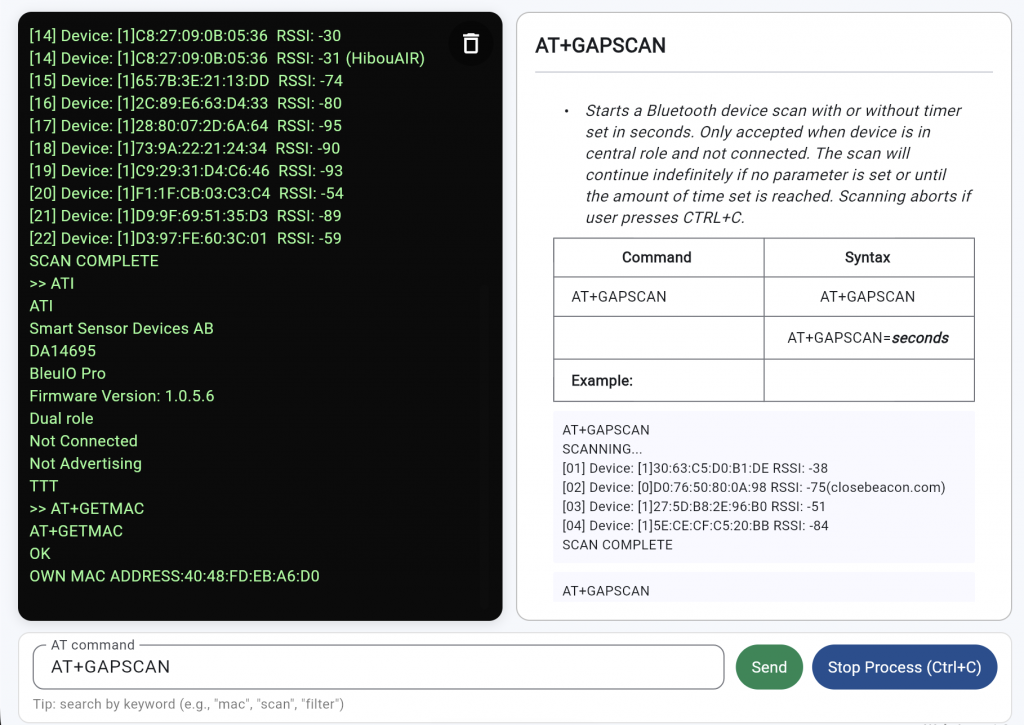
Integrated Help for Every Command
Each AT command in the app includes built-in help that explains how the command works, which parameters it accepts, and what type of response to expect. This information is available directly inside the interface, without requiring a separate documentation window.
By keeping command explanations close to where commands are executed, the app encourages experimentation while reducing mistakes. Developers can confidently adjust parameters and immediately see how those changes affect device behavior.
BLE Advertising Builder for Rapid Testing
Constructing BLE advertising payloads manually can be time-consuming and prone to errors. The BLE advertising builder simplifies this process by allowing developers to assemble payloads step by step using a clear interface.
By selecting a manufacturer ID and entering hex data, the app generates a valid advertising payload that can be copied and sent directly to the dongle. This is particularly useful for prototyping custom devices, testing advertising formats, or validating payload structures during development.
Powerful Search Across All AT Commands
The built-in search feature allows developers to explore the full set of AT commands by keyword. Instead of scrolling through documentation, developers can quickly find relevant commands related to topics such as security, pairing, or scanning and view their details immediately.
This turns the app into both a control interface and a reference tool, making it easier to learn the platform while actively working with the hardware.
Simple and Safe Firmware Updates
Firmware management is fully integrated into the BleuIO app, allowing developers to check installed firmware versions and update or downgrade firmware directly from the browser. The process is guided and designed to minimize the risk of errors.
For BleuIO Pro, firmware updates are straightforward and fast. For the standard BleuIO dongle, the app clearly guides the user through the additional step required during the update process. Once the update is complete, reconnecting and verifying the firmware version takes only a few moments.
Designed for Developers, Not Just Demos
The BleuIO app is more than a demonstration tool. It is built for daily development work, helping developers move faster by reducing setup time and keeping everything in one place. Tasks such as sending AT commands, scanning BLE devices, building advertising payloads, exploring command documentation, and managing firmware can all be handled from a single browser window.
If you prefer a visual walkthrough, there is also a detailed video that explains all the features of the BleuIO app and shows how to use them step by step. The video demonstrates real-time usage, including connecting a device, sending AT commands, scanning for BLE devices, building advertising payloads, and updating firmware. You can watch the video below to see the app in action.
By combining control, visibility, and guidance into one interface, the app supports both experienced developers and those who are new to BLE development.
Bluetooth Low Energy (BLE) sensors are excellent at collecting environmental data close to where it matters. Many air-quality devices broadcast their readings using BLE advertisements, which keeps power consumption low and avoids the overhead of maintaining a connection. The challenge appears when you want to access that data remotely, share it with a team, or visualize trends over time.
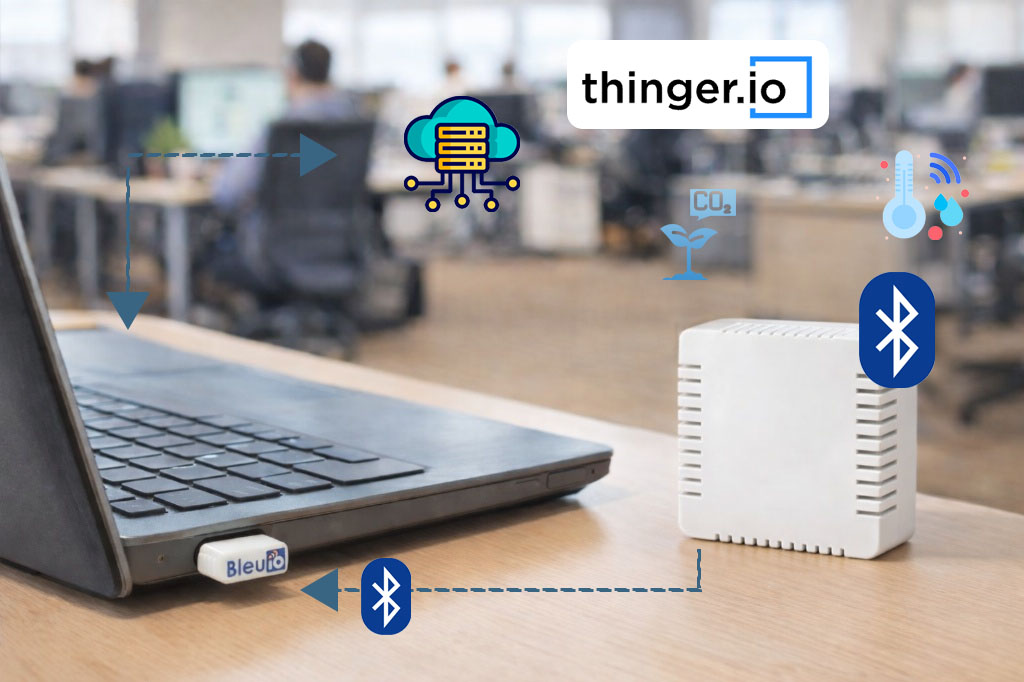
In this tutorial project, we demonstrate a simple and transparent way to bridge that gap. A BleuIO USB dongle scans BLE advertisements from a HibouAir sensor, a lightweight Python script decodes the values, and the data is sent to Thinger.io for storage and visualization. The goal is not to build a product-specific solution, but to show how easily BLE advertisement data can be integrated into a modern cloud platform using readily available tools.
From local BLE data to remote access
BLE advertisement data is, by design, local: a sensor broadcasts data into the surrounding area, and only nearby devices can receive it. This works perfectly for local dashboards, logging, or automation running on a PC or embedded computer. However, as soon as you want to view data remotely, share readings with others, analyze trends over longer periods, or build dashboards that are accessible from anywhere, a cloud layer becomes necessary. A gateway approach solves this neatly by listening to BLE advertisements, decoding them, and forwarding the results to the cloud without requiring changes to the sensor firmware or the addition of complex SDKs. This keeps the BLE side simple while allowing the cloud to handle storage, visualization, and access control.
About Thinger.io
Thinger.io offers a generous free tier that is well suited for prototyping, demos, and proof-of-concept projects. It allows you to create devices that accept data over HTTP, store incoming measurements in data buckets, and build dashboards with charts and widgets in just a few steps.
For this project, Thinger.io acts as a remote endpoint that receives decoded air-quality data and makes it immediately visible through its web dashboard. This makes it easy to demonstrate end-to-end data flow—from BLE advertisements in the air to charts in a browser—without maintaining your own backend.
No embedded firmware development and no BLE SDKs are required.
How the project works
The HibouAir device periodically broadcasts its sensor readings inside BLE advertisement packets. BleuIO, connected to computer via USB, continuously scans for nearby BLE advertisements and filters packets that match the HibouAir identifier.
A Python gateway script reads the scan output from BleuIO, extracts the raw advertisement payload, and decodes the air-quality values such as CO2, temperature, and humidity. These decoded values are then packaged into a simple JSON object and sent to Thinger.io using an authenticated HTTP request.
Thinger.io receives the data, stores it in a bucket, and makes it available for visualization on dashboards. This entire process runs continuously, creating a real-time BLE-to-cloud data pipeline without establishing a persistent BLE connection to the sensor.
Source code
The complete source code for this project is available on GitHub. It includes the Python gateway script, configuration examples, and setup notes.
On the Thinger.io side, the setup is straightforward. You create an HTTP device that acts as the data entry point, generate an access token for authentication, and configure a data bucket to store incoming measurements. Once the bucket is in place, dashboards can be built by adding widgets such as numeric values, gauges, or time-series charts.
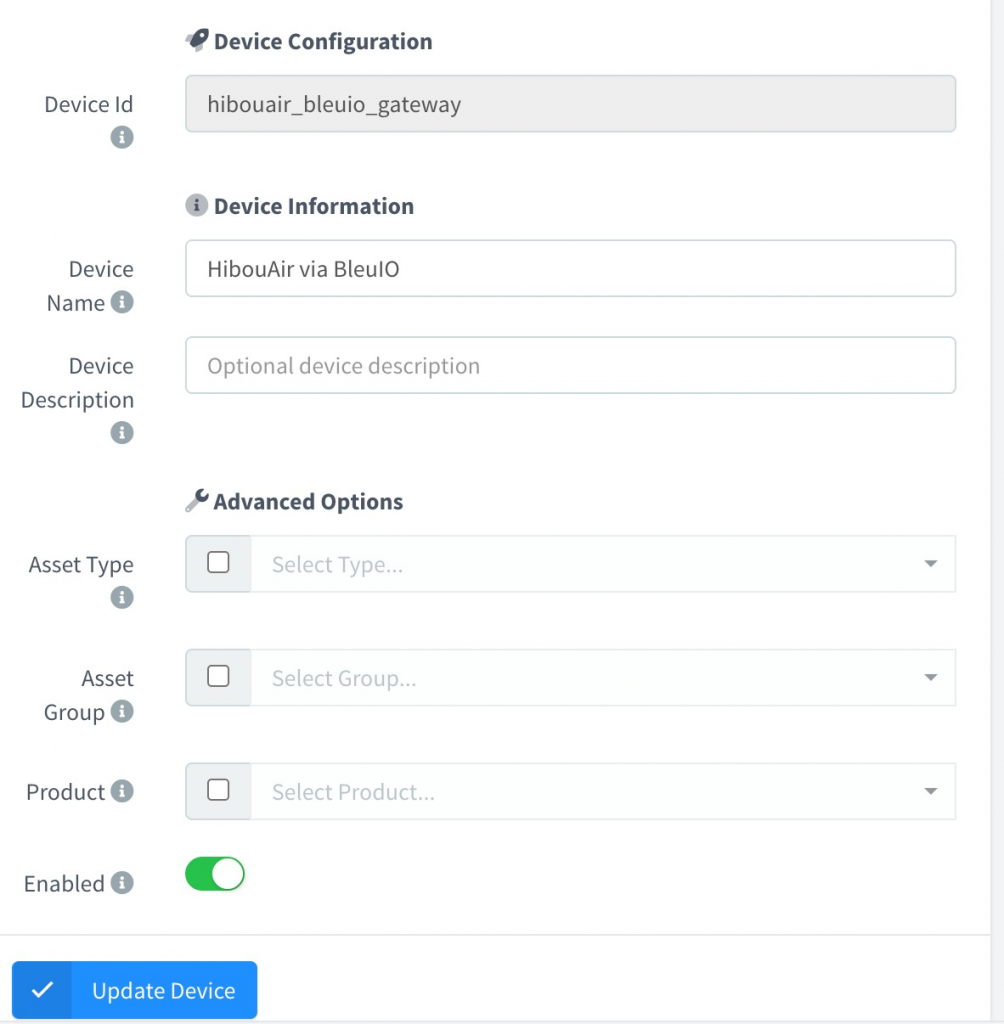
Step 1: Create an HTTP Device
Go to Dashboard → Devices and create a new device.
Click Add Device / New Device
Choose HTTP Device
Set a clear Device ID (example: hibouair_bleuio_gateway)
Save
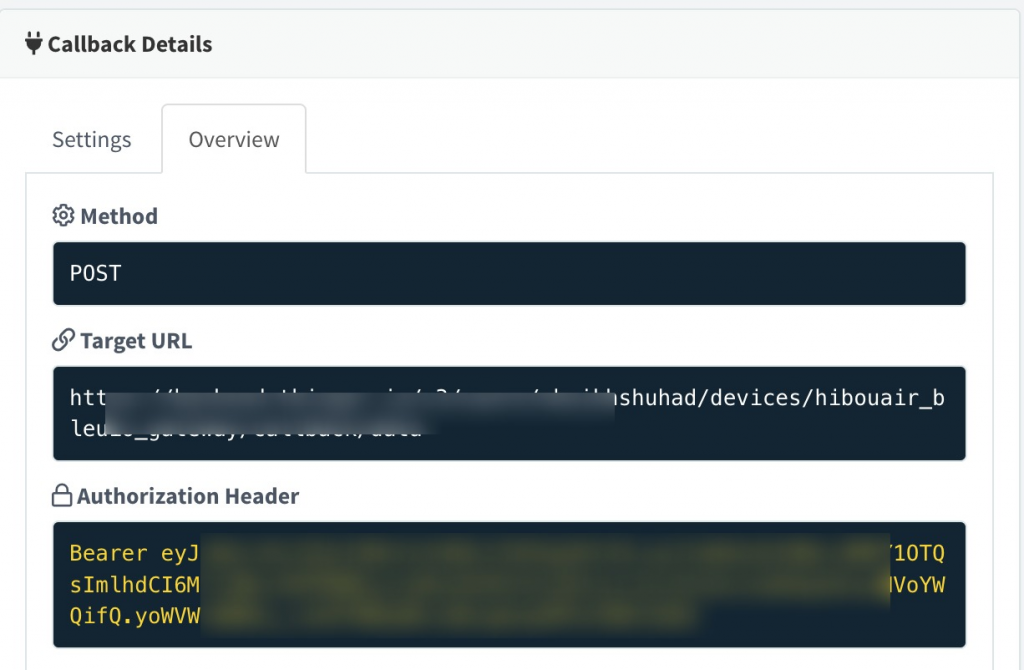
Step 2: Get the Callback URL (endpoint)
Open the device you just created and locate the callback endpoint that will receive your JSON payload.
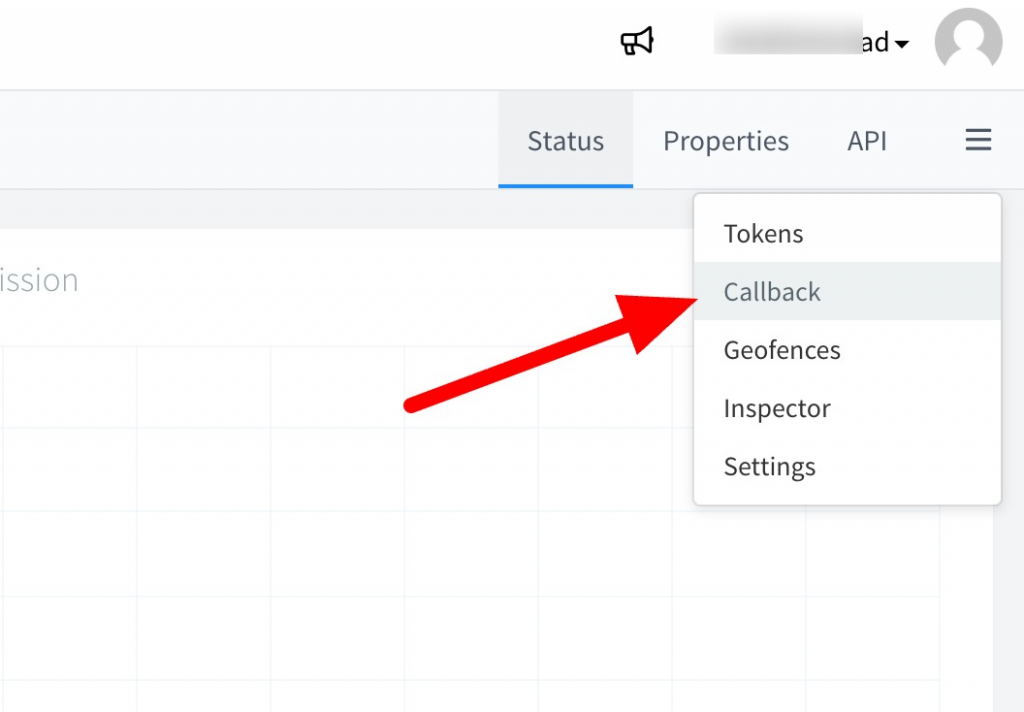
Click your device (example: hibouair_bleuio_gateway)
Go to Callback
Copy the Callback URL / Endpoint URL
This is the URL your Python gateway will send data to using an HTTP POST.
Step 3: Create a Data Bucket (storage)
Buckets store your incoming time-series data and make charts/dashboard widgets easy.
Go to Data Buckets
Click Create Bucket
Name it something like: hibouair_air_quality
Save
Step 4: Link the Device Callback to the Bucket
Now tell Thinger.io to store incoming device payloads into your bucket.
Go back to your device: Devices → hibouair_ble_gateway
Open Callback settings
Enable storing/forwarding incoming data to a bucket
Select bucket: hibouair_air_quality
Save
Step 5: Create a Dashboard
This is where the live visualization happens.
Go to Dashboards
Click New Dashboard
Name it: HibouAir Live (BleuIO)
Save
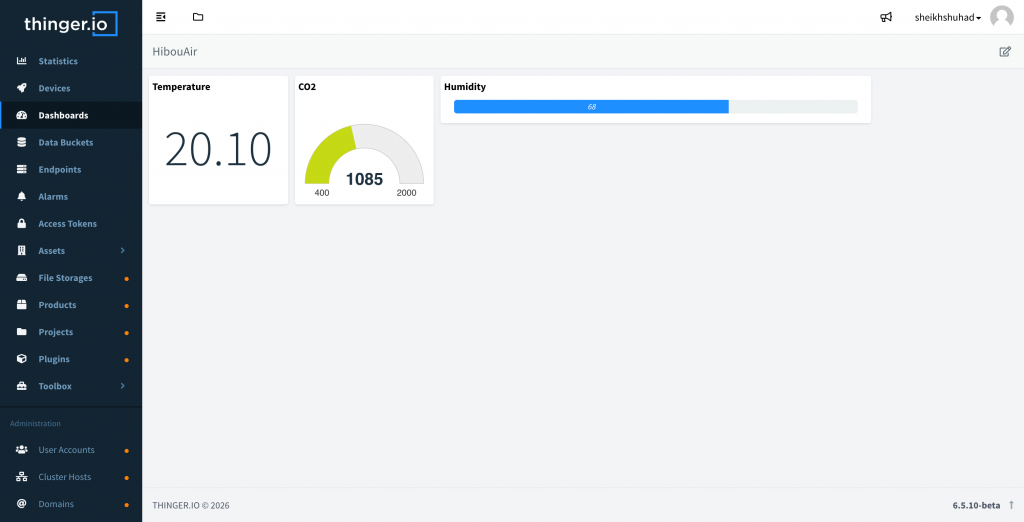
Step 6: Add widgets to visualize your data
Use the bucket as the data source for widgets.
Suggested widgets (example mapping):
Numeric / Value widget → co2_ppm
Gauge widget → temperature_c
Time-series chart → humidity_rh (and optionally CO2 too)
Steps:
Click Add Widget
Choose widget type (Value, Gauge, Chart)
Select bucket: hibouair_air_quality
Choose the field (co2_ppm / temperature_c / humidity_rh)
Save widget
Arrange widgets on the dashboard
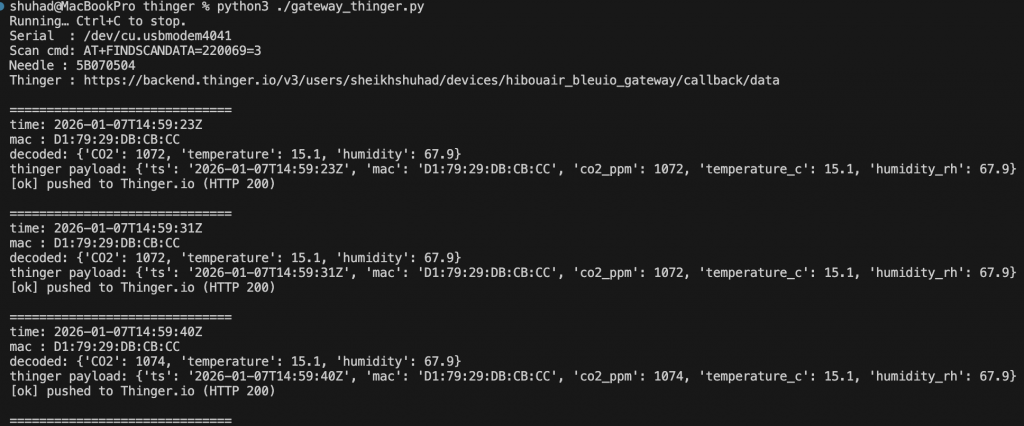
Running the gateway
After configuring the Thinger.io credentials and ensuring BleuIO is connected to the correct serial port, the project is started with a single command:
python3 gateway_thinger.py
Once running, the script scans for BLE advertisements, decodes the sensor data, and pushes updates to Thinger.io at regular intervals. Terminal output confirms successful scans and uploads, while the dashboard updates in near real time.
This project is meant to showcase an integration pattern, not to define a fixed solution. By combining BLE advertisement scanning with a simple Python gateway and a cloud platform like Thinger.io, it becomes clear how flexible this approach can be. Engineers can take this example, replace the sensor, adjust the decoder, or switch the cloud endpoint to suit their own needs.