We are excited to announce the release of BleuIO firmware v2.7.9.11, now available for all users. This update focuses on improving reliability and accuracy by addressing several important bugs identified in previous versions. Whether you are building BLE applications or integrating BleuIO into larger IoT systems, this release ensures a smoother and more dependable development experience.
Key Fixes in v2.7.9.11
Correct BLE Version Reporting Previously, certain BLE sniffers would incorrectly report the BleuIO dongle as supporting Bluetooth 4.2 instead of Bluetooth 5.0. This bug has now been fixed, ensuring accurate version reporting and alignment with the dongle’s full Bluetooth 5.0 capabilities.
Cleaner Advertising & Scan Response Data Default advertising and scan response data sometimes contained extra unknown Extended Inquiry Response (EIR) elements. These unnecessary data entries could lead to confusion when testing or deploying. With this fix, developers can now rely on clean and precise advertising packets, making it easier to design reliable BLE applications.
Accurate Preview of Advertising Data When setting custom advertising or scan response data using AT commands, the preview did not always match the actual values set. This issue has been resolved, giving developers more confidence when configuring advertising parameters for projects such as BLE beacons.
Duplicate Handle Reports Eliminated In some cases, the AT+NOTI and AT+INDI commands could return duplicate handles. This caused unnecessary repetition and clutter in test logs. With this update, handle reporting is streamlined, making service and characteristic testing more efficient and easier to interpret.
At BleuIO, we continuously refine our firmware to give developers a faster, more stable environment for building and testing Bluetooth Low Energy solutions. Each improvement—no matter how small—saves time in debugging, reduces misinterpretations, and ultimately accelerates your path from prototype to production.
If you are already using BleuIO, we recommend upgrading to the latest firmware to benefit from these bug fixes. For those new to the platform, you can get started by visiting our Getting Started Guide.
How to Update
Updating your dongle is straightforward. Simply follow the instructions in the Firmware Update Guide, and you’ll be running the latest version in minutes.
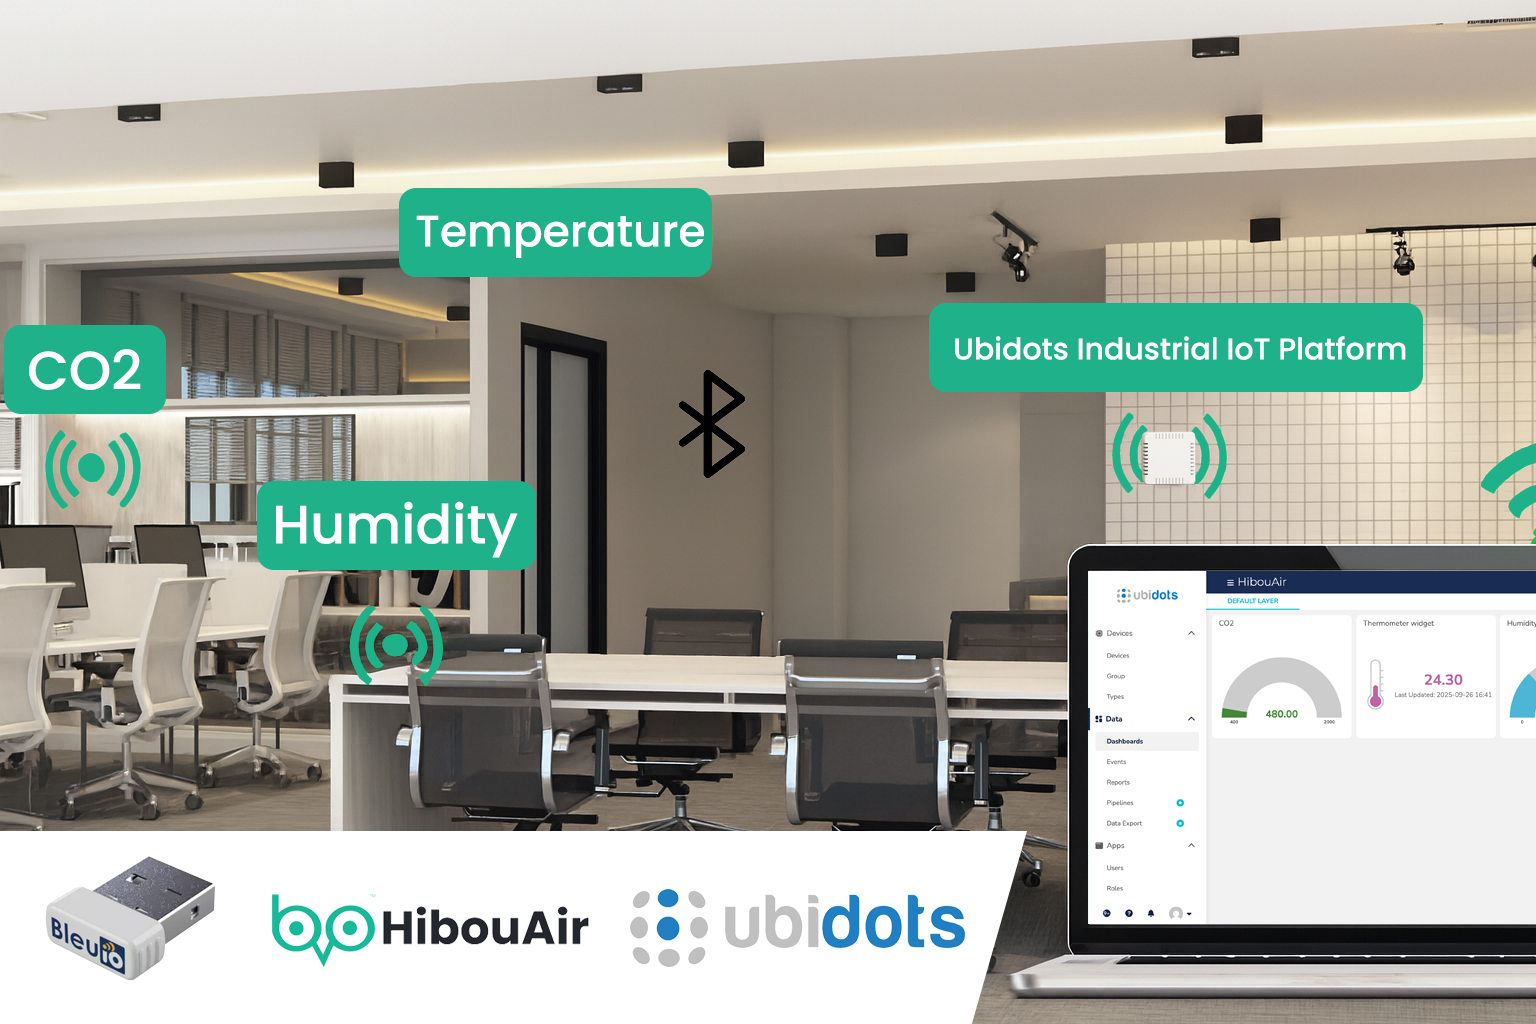
In this project, we’ll show how to build a real-time air quality monitoring system using the BleuIO USB dongle and Ubidots. The setup listens for Bluetooth Low Energy (BLE) advertising packets from a HibouAir sensor, decodes the CO2, temperature, and humidity data, and sends them directly to Ubidots, where you can visualize and analyze the readings on a live dashboard.
The result is a seamless pipeline from BLE sensor to Ubidots’ cloud platform. This makes it easy to track air quality in real time and share the results with colleagues, clients, or your own IoT applications.
What is Ubidots?
Ubidots is a powerful industrial IoT platform designed to help developers, researchers, and businesses transform raw sensor readings into meaningful insights. More than just a place to store data, Ubidots provides tools to build custom dashboards, alerts, and reports that can be shared across teams or even embedded into products. It is widely used in industries such as smart cities, agriculture, energy, logistics, and healthcare, where real-time monitoring and automation are critical.
By integrating BleuIO with Ubidots, you gain the ability to collect real-time BLE sensor data without the need for complex gateways. The values captured from your sensors can be pushed directly to Ubidots variables through simple HTTPS POST requests, making the process both fast and reliable. Once the data is in Ubidots, you can take advantage of its powerful dashboard features to create professional visualizations with gauges, charts, and triggers, giving you an intuitive way to monitor and analyze your environment.
In short, BleuIO acts as the BLE gateway, and Ubidots becomes the visualization and analytics layer.
HibouAir Sensor – broadcasts CO2, temperature, and humidity.
Python libraries: pip install pyserial requests
Ubidots account (a free version is available).
Ubidots API Token – used to authenticate when posting data to your account.
The Script and How It Works
We’ve written a Python script that automates the whole process from BLE scan to Ubidots push. You can find the full code on GitHub: GitHub Link for Script
Here’s how the script works step by step:
Connects to the BleuIO dongle over the serial port you specify (e.g., /dev/cu.usbmodemXXXX on macOS or COMX on Windows).
Switches the dongle into central mode with the AT+CENTRAL command (done only once).
Scans for HibouAir packets using AT+FINDSCANDATA=220069=3, which looks for advertising data that matches HibouAir’s manufacturer ID.
Selects the last valid packet that contains the expected pattern (5B070504). This ensures we work with the freshest data.
Decodes the advertising data into usable values:
CO in parts per million (ppm).
Temperature in Celsius (°C).
Humidity in relative percent (%RH). The script also applies sanity checks to ignore invalid readings.
Pushes the values to Ubidots via HTTPS POST requests. The request format looks like this: { "co2": { "value": 415 }, "temperature": { "value": 23.4 }, "humidity": { "value": 52.1 } } Each key (co2, temperature, humidity) becomes a variable in Ubidots.
The script repeats this process every 10 seconds, so your dashboard stays updated in real time.
This approach keeps everything lightweight and avoids any need for complex backend servers or brokers.
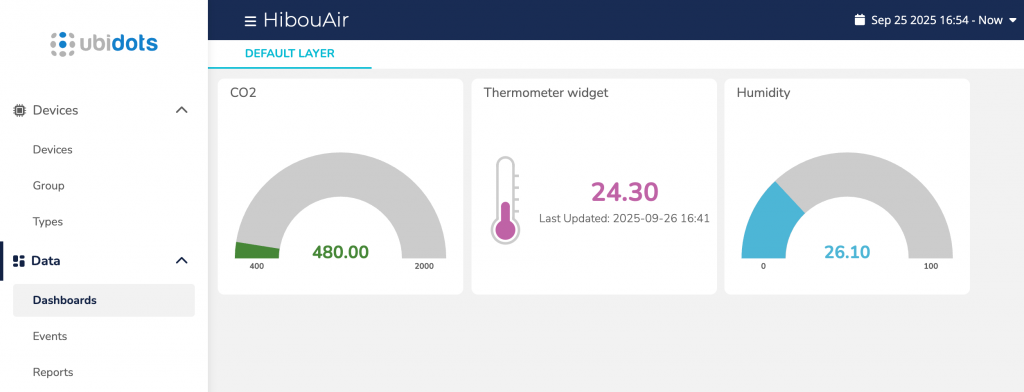
Output
Once the script is running, your Ubidots device (e.g., bleuio-hibouair) will automatically appear in the Devices section. It will have variables for CO2, temperature, and humidity.
Use Cases
This project can be applied in many real-world scenarios where air quality and environmental monitoring are essential. For example, it can be used for indoor air quality monitoring in offices, classrooms, or laboratories to ensure a healthy environment for occupants. In smart building management, the integration of CO₂ and temperature readings into HVAC systems can help optimize ventilation and energy use. The approach also fits perfectly into cold chain logistics, where continuous temperature and humidity tracking is critical for maintaining the safety and quality of sensitive shipments. In the field of environmental research, this setup provides a quick and reliable way to capture and visualize field data without the need for heavy infrastructure. Finally, it is also ideal for IoT prototyping, as Ubidots makes it easy to build dashboards and visualize sensor data quickly without writing or maintaining a backend system.
With just a BleuIO dongle, a BLE sensor, and a few lines of Python, you can build a real-time IoT dashboard in Ubidots. This project demonstrates how easy it is to collect, decode, and visualize BLE data without needing extra hardware or complicated setups.
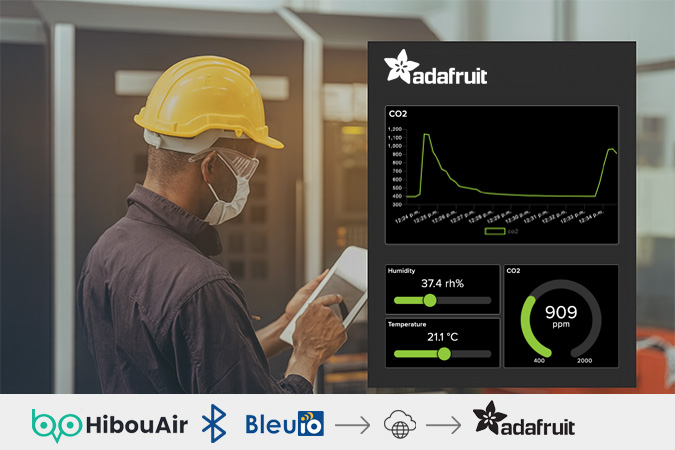
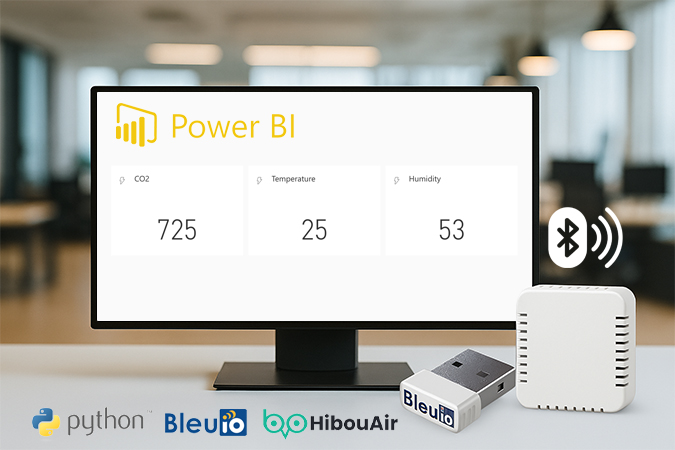
This project shows how to turn a BleuIO USB dongle into a tiny gateway that streams live air-quality data from a HibouAir sensor straight to Adafruit IO. The script listens for Bluetooth Low Energy (BLE) advertising packets, decodes CO2, temperature, and humidity, and posts fresh readings to your Adafruit IO feeds every few seconds. The result is a clean, shareable dashboard that updates in real time—perfect for demos, labs, offices, classrooms, and proofs of concept.
What is Adafruit IO—and why pair it with BleuIO?
Adafruit IO is a cloud platform for makers and developers that lets you collect, visualize, and route device data using a simple REST API or MQTT. You don’t need any Adafruit hardware; if you can make an HTTPS request, you can send data. BleuIO fits in beautifully here: the dongle handles the BLE side—scanning and parsing sensor frames—while a short Python script formats those values and pushes them to Adafruit IO. In practice that means you can take any BLE-advertising sensor, translate its packets into numbers, and land them on an IoT-friendly dashboard without servers or containers.
Requirements
To complete this project, you will need:
BleuIO BLE USB Dongle – acts as the BLE central device to capture advertising packets.
Adafruit IO Key – available under your account’s “My Key” page for authentication.
How it works
When you start the script, it opens the BleuIO serial port and switches the dongle into central role the very first time the program runs. From then on it repeatedly performs a short BLE scan that filters for HibouAir advertising frames. The scanner always picks the latest matching packet and decodes the fields we care about: CO2 (ppm), temperature (°C), and humidity (%rH). The script then posts each value to its own Adafruit IO feed over HTTPS. Because Adafruit IO is designed for live IoT data, your dashboard widgets update as soon as new points arrive. The loop cadence is configurable (10 seconds by default), which keeps you comfortably under Adafruit IO’s free-tier request limits.
The code (key points)
The script is intentionally small and readable. It opens the serial device (for example /dev/cu.usbmodemXXXX on macOS or COM7 on Windows), sends the BleuIO commands to scan for a few seconds, and parses the returned “Device Data [ADV]” lines.
A compact decoder extracts CO2, temperature, and humidity from the HibouAir manufacturer data, including the byte order and scaling.
To make the setup painless, credentials are read from variables (AIO_USER, AIO_KEY) and feed names default to co2, temperature, and humidity. Each value is sent to the REST endpoint /api/v2/{username}/feeds/{feed_key}/data with a simple JSON body {"value": <number>}.
The script includes gentle sanity checks (for example, temperature range and humidity bounds) to ignore any malformed frames, and it prints a concise log line each time it pushes fresh data.
Here is the GitHub link with the full source so you can clone and run it as-is or adapt it to other sensors.
How to run the code
Before running, set your serial port and Adafruit IO credentials.
On macOS you can list ports with ls /dev/cu.usbmodem*;
on Windows use Device Manager to find the COM number. Update username and AIO key information, then run the script. The program will put BleuIO into central mode on first launch and, every cycle, will scan, decode, and push CO2, temperature, and humidity to the three feeds. If you see an HTTP 401 error, double-check the AIO key; a 404 usually means a feed name typo. If the script can’t open the serial port, confirm the path and that no other program is holding it open.
Creating Adafruit IO feeds, key, and dashboard
Log in to Adafruit IO and create three feeds named co2, temperature, and humidity. Your AIO Key is available under your account’s “My Key” page; copy it and keep it private. With feeds in place, open the Dashboards section and create a new dashboard for this project (for example, “HibouAir Live”). Add a few blocks: a gauge or line chart for CO₂ (with a range that makes sense for your space), another gauge or slide for temperature, and a slide or line chart for humidity so you can see the trend over time. Each block points to its corresponding feed. As the script posts to those feeds, the blocks will animate and refresh automatically. You can reorder blocks, tweak colors and ranges, and share a read-only link if you want others to watch along.
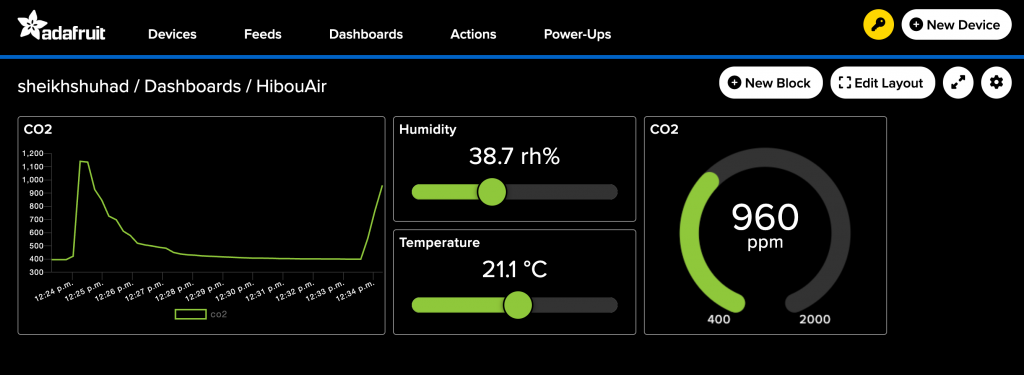
Output
Once everything is connected, the dashboard shows a live CO2 number in gauge an line chart, an updating temperature value, and a humidity box that advances with each new reading. The values move in near real time as the script cycles, and any spikes or changes in air quality appear immediately.
Use cases
Real-time air-quality dashboards are useful in far more places than a lab bench. Facility manager can watch CO2 levels across meeting rooms to optimize ventilation; schools and libraries can surface temperature and humidity alongside occupancy schedules; small manufacturers can keep an eye on comfort and safety in production spaces; and hobbyists can monitor their home offices or studios. Because the pipeline is “BLE sensor → BleuIO → HTTPS → Adafruit IO,” you can swap HibouAir for other BLE advertisers and reuse the same approach to visualize anything from soil moisture to ambient light.
This project highlights how quickly you can go from BLE broadcast to live cloud dashboard with BleuIO and Adafruit IO. There’s no server to maintain, no container to deploy—just a tiny USB dongle, an air quality monitoring device like HibouAir, a short Python script, and a few clicks on the Adafruit IO site. The result is a shareable, real-time view of your environment that’s easy to extend, brand, and automate.
In this project, we demonstrate how to stream Bluetooth Low Energy (BLE) sensor data directly into Microsoft Power BI using the BleuIO USB dongle. By combining a HibouAir environmental sensor with BleuIO and a simple Python script, we can capture live readings of CO2, temperature, and humidity and display them in real time on a Power BI dashboard.
The goal of this project is to make BLE data visualization simple and accessible. Instead of dealing with complex server setups or containers, BleuIO provides an easy way to turn raw BLE advertising packets into meaningful insights that anyone can understand at a glance.
Why Power BI?
Microsoft Power BI is a business analytics platform designed to turn raw data into interactive dashboards and reports. One of its most powerful features is the ability to handle real-time streaming datasets, allowing live updates from sensors or IoT devices.
For IoT developers and organizations, this is a game-changer. Imagine watching air quality readings from your office appear in real time, or combining BLE sensor data with other business metrics to get a fuller picture of your environment. By using BleuIO as a BLE-to-cloud bridge, developers can integrate IoT data into Power BI dashboards quickly, without heavy infrastructure.
Toggle Historic data analysis ON if you want Power BI to store rows for reporting.
Save the dataset and copy the Push URL that Power BI generates. This will look something like: https://api.powerbi.com/beta/.../datasets/{id}/rows?key=...
This Push URL is what the Python script will use to send live sensor data to your dashboard.
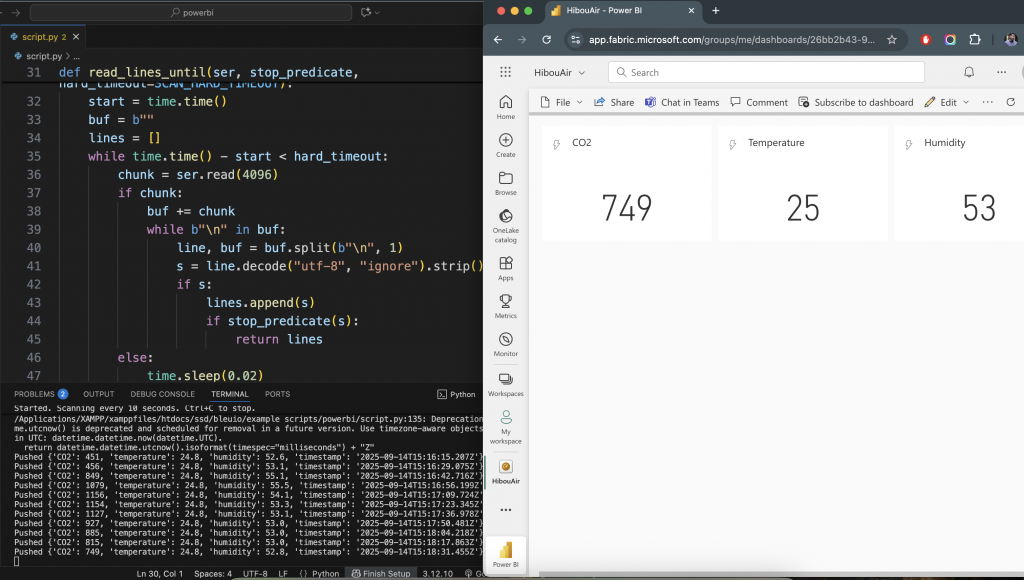
The Script
We wrote a Python script that takes care of the entire process. Once it starts, the script connects to the BleuIO dongle through the serial port and switches it into central mode (this is done only the first time it runs). From then on, it performs a BLE scan every 10 seconds, specifically looking for HibouAir sensor advertising data. When the sensor is found, the script decodes the broadcast payload into CO2, temperature, and humidity values. These values are then packaged into the required JSON format and pushed directly to Power BI, where they appear instantly on your dashboard.
Before running the script, make sure to update two important details:
Dongle port location: On macOS it will look like /dev/cu.usbmodemXXXX, while on Windows it will appear as COMX.
Power BI Push URL: Use the one you generated earlier during the dataset setup.
With the script running and sending live data, the next step is to build your Power BI dashboard.
Go to My workspace in Power BI and click New → Dashboard.
Give the dashboard a descriptive name, for example HibouAir Live Data.
Select + Add a tile → Custom streaming data, then choose the dataset you created earlier.
Pick a visualization type that suits your needs:
A Card to display the current CO₂ value.
A Gauge to track temperature within a target range.
A Line chart to watch humidity changes over time.
Map the fields (CO2, temperature, humidity, timestamp) to each visual and pin them to your dashboard.
Within seconds of running the script, you’ll see live sensor readings begin to appear in your Power BI dashboard — updating automatically with every scan.
Output
Here’s what the final result looks like when the dashboard starts receiving data from the HibouAir sensor.
Use Cases
This project shows just one way to use BLE and Power BI together, but the possibilities are broad. For example, you could build air quality monitoring dashboards in offices, schools, or factories to help maintain healthier environments. In agriculture, farmers could create smart dashboards that combine soil and environmental sensors to optimize crop conditions. The same method can be applied to cold chain logistics, where monitoring temperature and humidity is essential for transporting food or medicine. Fitness and health enthusiasts could stream real-time data from BLE wearables into personal dashboards, making progress more visible and motivating. And for developers, Power BI is an excellent tool for rapid IoT prototyping, offering instant visualization of new sensor data without building a complex backend system.
With BleuIO and Microsoft Power BI, it’s easy to transform BLE sensor broadcasts into live dashboards. This integration makes it possible to visualize environmental data in real time, share insights instantly, and build prototypes faster than ever before. Whether you’re a developer, researcher, or business professional, combining BLE sensors with Power BI opens the door to smarter, data-driven decisions.
We are happy to announce the release of BleuIO firmware v2.7.9.6. This update brings an important new feature designed to make your device more secure: password protection for the AUTOEXEC list.
With this functionality, you can lock your AUTOEXEC list using a password. Once locked, no one can read, modify, or delete the commands inside unless they enter the correct password. The password will remain active even after power cycles, ensuring your setup stays protected. Please note that updating the firmware to a different version will clear the password.
What’s New in v2.7.9.6
Added Functionality
Ability to lock the AUTOEXEC list with a password.
Password protection persists through power cycles.
Updating firmware to another version will clear the password.
New Commands
We’ve introduced three new AT commands to manage this feature:
AT+SETAUTOEXECPWD
Create or change a password for the AUTOEXEC list.Requires the old password if you want to change it.Maximum length: 255 ASCII characters.
Example:AT+SETAUTOEXECPWD=my_password
AT+ENTERAUTOEXECPWD
Used to enter the password when prompted.Grants access to locked commands.
AT+CLRAUTOEXECPWD
Clears the existing password (requires entering the password first).Returns the AUTOEXEC list to an unprotected state.
How to Use the New Feature
The recommended way to use this functionality is:
Add commands to your AUTOEXEC list as usual.
Lock the list by setting a password with AT+SETAUTOEXECPWD.
If you need to make changes later:
Use AT+CLRAUTOEXECPWD to remove the password.
Modify your AUTOEXEC list.
Lock it again using AT+SETAUTOEXECPWD.
When a password is set, the following commands will require authentication first:
AT+CLRAUTOEXECPWD
AT+SETAUTOEXECPWD
AT+AUTOEXEC
AT+AUTOEXECLOOP
AT+CLRAUTOEXEC
Why This Matters
The AUTOEXEC list is a powerful tool that allows you to automate commands when your BleuIO dongle starts up. By adding password protection, you ensure that only authorized users can view or change these startup configurations. This is especially important in production environments where security and stability are critical.
Update Today
We encourage all users to update to v2.7.9.6 to take advantage of this new security feature. For full release notes and instructions, visit our documentation page.