Plotting Real-Time Air Quality Data from a Bluetooth Air Quality Monitoring Device Using MATLAB

With the rise of IoT devices, Bluetooth Low Energy (BLE) technology has emerged as a convenient solution for wireless data transmission. In this tutorial, we’ll explore how to read real-time air quality data from a BLE air quality monitoring device called HibouAir, and plot it using MATLAB. To accomplish this, we’ll utilize the BleuIO BLE USB dongle, which simplifies BLE application development with its AT command interface.

Project Components:

  1. BleuIO BLE USB Dongle: The BleuIO dongle serves as our BLE interface, allowing us to communicate with BLE devices using simple AT commands. Its plug-and-play nature and versatile features make it an ideal choice for BLE application development.
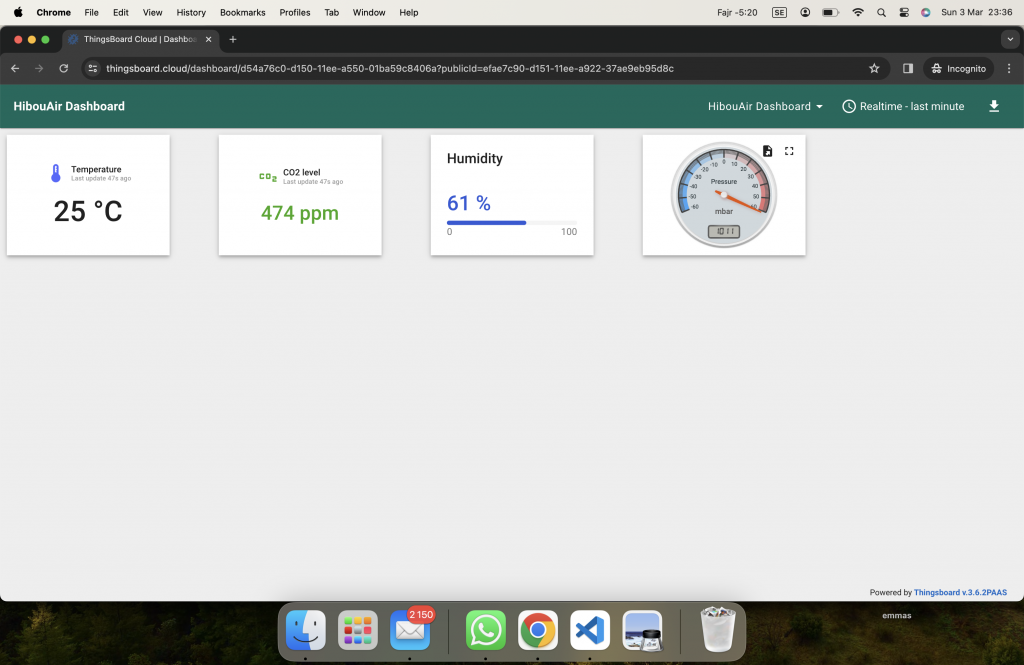
  2. HibouAir Air Quality Monitoring Device: HibouAir is a BLE-enabled air quality monitoring device that measures various parameters such as CO2, temperature, humidity, VOCs, and more. It provides real-time data transmission via BLE, making it suitable for IoT applications.
  3. MATLAB: MATLAB is a powerful computing environment widely used for data analysis, visualization, and algorithm development. We’ll leverage MATLAB’s capabilities to read data from the BleuIO dongle, decode BLE advertisements from HibouAir, and plot the air quality data in real-time.

Project Implementation:

Step 1: Setting up the Hardware

  • Connect the BleuIO BLE USB dongle to your computer’s USB port.
  • Power on the HibouAir air quality monitoring device.

Step 2: Writing MATLAB Code

  • Define the serial port parameters in MATLAB to establish communication with the BleuIO dongle.
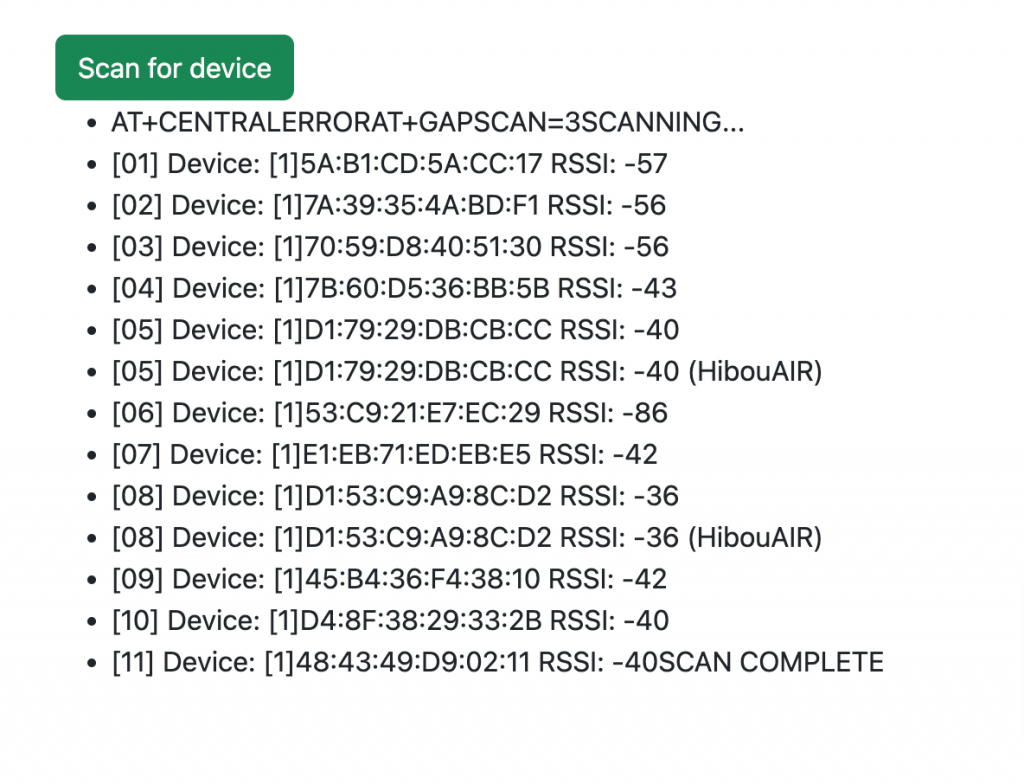
  • Scan for a specific HibouAir device with its MAC address to get air quality advertised data.
  • Implement functions to decode BLE advertisement data from HibouAir, including parsing CO2, temperature, humidity, and other relevant parameters.
  • Write code to continuously scan for BLE advertisements, extract air quality data, and plot co2 value real-time using MATLAB’s plotting functions.

How This Project Can Be Helpful for Engineers, Developers, and Analysts

Environmental Monitoring: Engineers and analysts can use this project to create efficient environmental monitoring systems. By integrating BLE air quality monitors with MATLAB’s data analysis tools, they can assess air quality, detect anomalies, and optimize environmental control systems.

Use Case: A civil engineering firm employs this setup to monitor indoor air quality in commercial buildings, identifying areas needing ventilation improvements.

IoT Development: Developers can leverage this project to build IoT applications across various industries. By connecting BLE monitors with cloud platforms and mobile apps, they enable remote monitoring and predictive maintenance.

Use Case: A startup develops a mobile app for real-time air quality monitoring in urban environments, using BLE devices and MATLAB for data analysis.

Research and Analysis: Analysts and researchers can utilize this project to study air quality’s impact on human health and the environment. BLE monitors and MATLAB enable them to collect data, perform statistical analysis, and communicate research findings effectively.

Use Case: Environmental scientists deploy BLE monitors to measure traffic-related air pollution in urban areas, using MATLAB to analyze data and inform urban planning decisions.

Complete MATLAB Code:

% Define the serial port parameters
portName = 'COM8';  % Change this to match your dongle's port identifier
baudRate = 57600;   % Change this to match your dongle's baud rate
macaddress = '220069'; % Change this to match the desired MAC address

% Define adv_data_decode function if not defined already
function env_data = adv_data_decode(data)
    % Initialize output structure
    env_data = struct();
    
    % Find the position of the start of advertisement data
    pos = strfind(data, '5B070');

    % Convert hexadecimal data to decimal values
    temp_hex = convertNumber(data, pos+22, 4);
    if temp_hex > 1000
        temp_hex = (temp_hex - (65535 + 1)) / 10;
    else
        temp_hex = temp_hex / 10;
    end

    % Decode the advertisement data
    env_data.boardID = data(pos + 8 : pos + 8 + 5);
    env_data.type = hex2dec(data(pos + 6 : pos + 6 + 1));
    env_data.light = convertNumber(data, pos + 14, 4);
    env_data.pressure = convertNumber(data, pos + 18, 4) / 10;
    env_data.temperature = temp_hex;
    env_data.humidity = convertNumber(data, pos + 26, 4) / 10;
    env_data.voc = convertNumber(data, pos + 30, 4);
    env_data.co2 = hex2dec(data(pos + 46 : pos + 46 + 3));
    env_data.ts = datetime('now', 'Format', 'yyyy-MM-dd HH:mm:ss');
end

function num = convertNumber(data, start, len)
    % Convert hexadecimal string to decimal number
    hex_str = data(start : start + len - 1);
    num = typecast(uint32(hex2dec(hex_str)), 'int32');
end

% Create a function to handle the scanning and decoding
function scanAndDecode(~, ~, s, macaddress, hObject)
    try
        % Retrieve stored data from the figure's appdata
        fig = ancestor(hObject, 'figure');
        storedData = guidata(fig);
        timeArray = storedData.timeArray;
        co2Array = storedData.co2Array;
        
        % Send the commands
        writeline(s, "AT+CENTRAL");
        write(s,13,"char");
        writeline(s, "AT+FINDSCANDATA="+macaddress+"=4");
        write(s,13,"char");
        
        % Pause for 4 seconds (assuming this is the time needed for scanning)
        pause(4);
        
        % Read the response
        response = '';
        while s.NumBytesAvailable > 0
            response = response + readline(s);
        end

        % Extract advertisement data from the last string
        lastLine = strsplit(response, newline);
        lastLine = lastLine{end};  % Get the last line
        advData = regexp(lastLine, '\[ADV\]:\s+(\w+)', 'tokens');

        % Display the advertisement data
        if ~isempty(advData)
            theData = adv_data_decode(advData{1}{1});
            disp(theData.co2); % Display CO2 data for example
            
            % Append new data points to arrays
            timeArray = [timeArray, datenum(theData.ts)]; % Convert datetime to serial date number
            co2Array = [co2Array, theData.co2];
            
            % Update stored data in the figure's appdata
            storedData.timeArray = timeArray;
            storedData.co2Array = co2Array;
            guidata(fig, storedData);
            
            % Update plot with new data points
            set(hObject, 'XData', timeArray, 'YData', co2Array);
            % Set x-axis to display time in the format of hours, minutes, and seconds
            datetick('x', 'HH:MM:SS');
            drawnow;
        else
            disp('No advertisement data found.');
        end

    catch e
        % Display any errors that occur
        disp("An error occurred: " + e.message);
    end
end

try
    % Create a serial port object
    s = serialport(portName, baudRate,"Timeout",2);
    configureTerminator(s, "LF");

    % Create a figure for plotting
    fig = figure;
    plotHandle = plot(NaN, NaN, 'o-');
    xlabel('Time');
    ylabel('CO2 Value');
    title('CO2 Value vs. Time');

    % Store data in the figure's appdata
    storedData.timeArray = [];
    storedData.co2Array = [];
    guidata(fig, storedData);

    % Create a timer object to run scanAndDecode every 10 seconds
    t = timer('ExecutionMode', 'fixedRate', 'Period', 10, ...
              'TimerFcn', {@scanAndDecode, s, macaddress, plotHandle});

    % Set the closerequestfcn callback to stop the timer and clear the serial port
    set(fig, 'closerequestfcn', {@stopScript, t, s});

    % Start the timer
    start(t);

catch e
    % Display any errors that occur
    disp("An error occurred: " + e.message);

    % Stop and delete the timer
    if exist('t', 'var') && isvalid(t)
        stop(t);
        delete(t);
    end

    % Close the serial port
    if exist('s', 'var') && isvalid(s)
        clear s;
    end
end

% Enable data cursors
dcm = datacursormode(gcf);
set(dcm, 'UpdateFcn', @customDataCursor);

% Custom data cursor function
function output_txt = customDataCursor(~, event_obj)
    % Get the data cursor position
    pos = get(event_obj, 'Position');
    
    % Convert the x-coordinate (time) to a formatted string
    timeString = datestr(pos(1), 'HH:MM:SS');
    
    % Create the output text to display
    output_txt = {['X: ', timeString], ['Y: ', num2str(pos(2))]}; % Customize as needed
end

function stopScript(~, ~, t, s)
    % Stop and delete the timer
    if exist('t', 'var') && isvalid(t)
        stop(t);
        delete(t);
    end

    % Close the serial port
    if exist('s', 'var') && isvalid(s)
        % Close the serial port
        delete(s);
    end

    % Close the figure
    delete(gcf);
end

Output

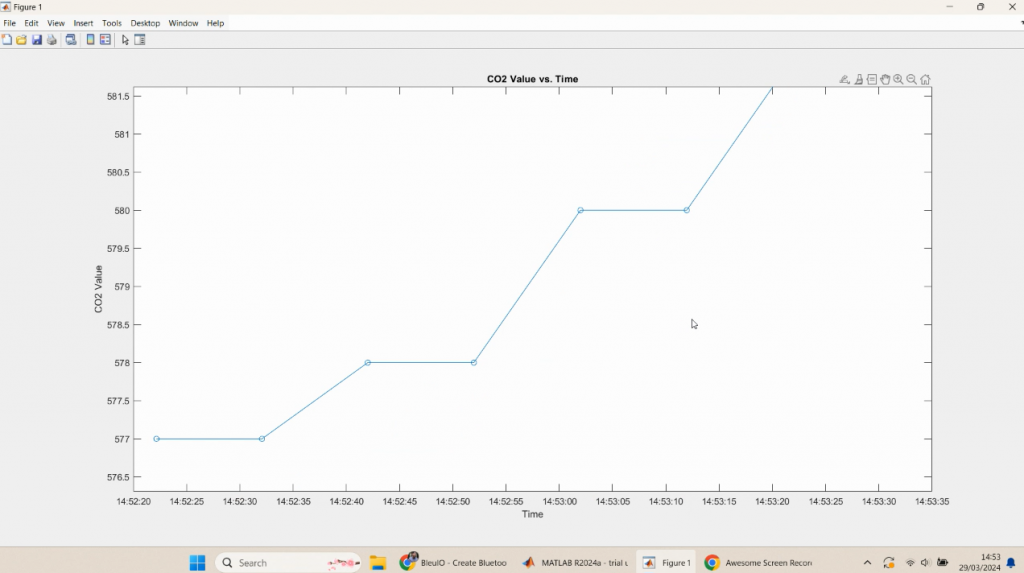
In this tutorial, we demonstrated how to read real-time air quality data from a BLE air quality monitoring device, such as HibouAir, using the BleuIO BLE USB dongle and MATLAB. By following the steps outlined in this tutorial, engineers, developers, and analysts can develop applications for monitoring air quality in various environments. This project has numerous potential applications, including indoor air quality monitoring in smart buildings, environmental monitoring in industrial settings, and health monitoring in healthcare facilities. By leveraging the power of BLE technology and MATLAB’s data analysis capabilities, users can gain valuable insights into air quality trends and make informed decisions to improve environmental conditions and human health.

Share this post on :

Interfacing BleuIO with Node.js Using Serial Communication

In this tutorial, we’ll explore how to utilize BleuIO, a Bluetooth Low Energy (BLE) USB dongle, with Node.js for BLE application development. We’ll use the serialport library to communicate with BleuIO, enabling us to send AT commands and interact with BLE devices.

Prerequisites

Before we begin, ensure you have the following:

Setting Up the Project

  1. Project Structure: Create a new directory for your project. Inside this directory, create the following files:
    • index.html: HTML file for the frontend (optional).
    • server.js: Node.js backend server.
    • package.json: Node.js package configuration file.
  2. Initialize Node.js Project: Initialize a new Node.js project and install necessary dependencies.
mkdir bleuio-node-serial
cd bleuio-node-serial
npm init -y
npm install express serialport

Writing the Code

Let’s write the code for each component:

  • Node.js Backend (server.js): This file sets up an Express server to serve the HTML file and handles BLE interactions using BleuIO and serialport.
// server.js
const express = require('express');
const { SerialPort } = require('serialport');

const app = express();
const port = 3000;

// Serve the HTML file (optional)
app.get('/', (req, res) => {
  res.sendFile(__dirname + '/index.html');
});

// Endpoint to scan for BLE devices using BleuIO
app.get('/scanbledevice', (req, res) => {
  // Replace the following code with your BLE scanning logic
  const bleDevices = ['Device 1', 'Device 2', 'Device 3'];
  res.json(bleDevices);
});

// Start the server
app.listen(port, () => {
  console.log(`Server is running on http://localhost:${port}`);
});
  • BLE Scanning Logic: Implement BLE scanning logic using BleuIO and serialport in the server file (server.js). This module contains the function to scan for BLE devices using BleuIO.
// scanble.js
const { SerialPort } = require('serialport');

function scanBLE() {
  return new Promise((resolve, reject) => {
    // Use SerialPort to list available ports
    SerialPort.list()
      .then((ports) => {
        // Filter ports to find BleuIO device
        const blePorts = ports.filter((port) =>
          port.manufacturer.includes('Smart Sensor Devices')
        );

        if (blePorts.length === 0) {
          reject(new Error('BleuIO device not found'));
        }

        // Connect to the first found BleuIO device
        const blePort = new SerialPort({
          path: blePorts[0].path,
          baudRate: 115200
        });

        // Perform BLE scan
        blePort.write('AT+CENTRAL\r', (err) => {
          if (err) {
            reject(new Error('Error setting central role: ' + err.message));
          } else {
            blePort.write('AT+GAPSCAN=3\r', (err) => {
              if (err) {
                reject(new Error('Error initiating scan: ' + err.message));
              } else {
                setTimeout(() => {
                  // Read and parse scan results
                  const scanResults = blePort.read();
                  resolve(scanResults.split('\n'));
                }, 3500);
              }
            });
          }
        });
      })
      .catch((err) => {
        reject(new Error('Error listing serial ports: ' + err.message));
      });
  });
}

module.exports = { scanBLE };
  • HTML Frontend (index.html): This file provides a user interface (UI) to trigger BLE device scanning and display the results.
<!-- index.html -->
<!DOCTYPE html>
<html lang="en">
  <head>
    <!-- Include necessary meta tags and stylesheets -->
    <title>Scan BLE Device</title>
  </head>
  <body>
    <div class="container">
      <br />
      <br />
      <button class="btn btn-success" id="scanBtn">Scan for Devices</button>
      <div id="listScan"></div>
    </div>

    <!-- Include JavaScript for button click event -->
    <script>
      // JavaScript to handle button click event
    </script>
  </body>
</html>

Running the Application

  • Ensure your BleuIO dongle is connected to your computer.
  • Run the Node.js server
npm start
  • Open your web browser and navigate to http://localhost:3000.
  • Click the “Scan for Devices” button.
  • The list of nearby BLE devices will be displayed on the web page.

Output

In this tutorial, we’ve explored how to use BleuIO with Node.js via serial communication using the serialport library. You can extend this project by integrating more BLE functionalities and building a robust BLE application.

Feel free to customize and expand upon this project according to your requirements and explore the vast possibilities of BLE application development with Node.js and BleuIO!

Share this post on :

Using BleuIO with Thingsboard to Monitor Air Quality

Project Details

In this project, we’ll create a system to monitor air quality in real-time using BleuIO (A Bluetooth Low Energy USB dongle). We’ll scan for an air quality monitoring device called HibouAir and decode the advertised data. The decoded air quality data will then be sent to the ThingsBoard cloud platform for visualization and monitoring.

Introduction to BleuIO

For this project, we’ll utilize a BLE USB dongle called BleuIO. BleuIO is a versatile Bluetooth low energy USB dongle that simplifies the development of BLE applications. It offers a range of AT commands, making it easy to interact with the dongle and create applications. BleuIO supports multiple platforms and programming languages. In our case, we’ll be using Python with the BleuIO Python library, available on PyPI.

About HibouAir

HibouAir is an advanced air quality monitoring device, HibouAir offers real-time data on various critical parameters including CO2 levels, particulate matter (PM 1.0, PM 2.5, PM 10), pressure, temperature, humidity, volatile organic compounds (VOCs), and noise levels. With its plug-and-play setup helps users to take immediate control of their indoor air quality.

About ThingsBoard

ThingsBoard is an open-source IoT platform that enables users to collect, store, visualize, and analyze data from connected devices in real-time. It provides a comprehensive set of features for building scalable and customizable IoT applications, including device management, data processing, rule engine, and customizable dashboards. With ThingsBoard, users can easily connect their devices, monitor their performance, and take actions based on real-time data insights. Its user-friendly interface and flexible architecture make it suitable for a wide range of IoT use cases, from industrial automation and smart cities to agriculture and healthcare. Additionally, ThingsBoard offers seamless integration with various third-party platforms and services, allowing users to leverage existing technologies and expand the capabilities of their IoT solutions.

Hardware Requirements

Project Setup

  1. Install the BleuIO Python library:
    First, we need to install the BleuIO Python library, which allows us to interact with the BleuIO USB dongle. You can install it using pip:
    pip install bleuio
  2. Scan for nearby BLE devices:
    from bleuio_lib.bleuio_funcs
    import BleuIO
    import time
    my_dongle = BleuIO()
    my_dongle.at_central()
    my_dongle.at_findscandata('220069') # Replace '220069' with the device ID time.sleep(3)
    my_dongle.stop_scan()
  3. Decode the advertised data
    last_element = my_dongle.scan_data[-1]
    data_part = json.loads(last_element[0])['data']
    last_part = data_part.split(',')[-1].strip('"}')
    decoded_env_data = adv_data_decode(last_part)
  4. Send data to ThingsBoard
    import requests api_endpoint = 'https://thingsboard.cloud/api/v1/YOUR_API_KEY/telemetry'
    response = requests.post(api_endpoint, json=decoded_env_data)
    if response.status_code == 200:
    print("Data sent successfully to ThingsBoard.")
    else:
    print("Failed to send data to ThingsBoard. Status code:", response.status_code)

Decoding Advertised Data

The advertised data contains encoded air quality data. We’ve implemented a function called adv_data_decode to decode this data based on the HibouAir datasheet. The decoded data includes parameters such as temperature, humidity, CO2 levels, etc.

Integration with ThingsBoard

We use the ThingsBoard cloud platform to visualize and monitor the air quality data. We send the decoded data to ThingsBoard via a POST request to the Telemetry API endpoint. If the request is successful, we receive a confirmation message.

ThingsBoard setup

We have created a device called HibouAir and added pressure , temperature , co2, humidity widget attribute on my dashboard and this is how my dashboard looks. we can see latest data ( data updated 1 mins ago)

Code

Complete code is available on the following repository

https://github.com/smart-sensor-devices-ab/thingsboard-ble-integration

Output

The dashboard can be visited using the following link
https://thingsboard.cloud/dashboard/d54a76c0-d150-11ee-a550-01ba59c8406a?publicId=efae7c90-d151-11ee-a922-37ae9eb95d8c

With BleuIO and ThingsBoard integration, we’ve built a robust system for monitoring air quality in real-time. This project demonstrates the BleuIO can be used in ThingsBoard integrationto create IoT solutions for environmental monitoring.

Share this post on :