In this tutorial, we build a simple but practical web application that demonstrates how BleuIO can be integrated with a modern web framework to interact with Bluetooth Low Energy (BLE) devices in real time. The goal of this project is not to create a full-featured product, but to provide a clear example that developers can learn from and extend for their own use cases.
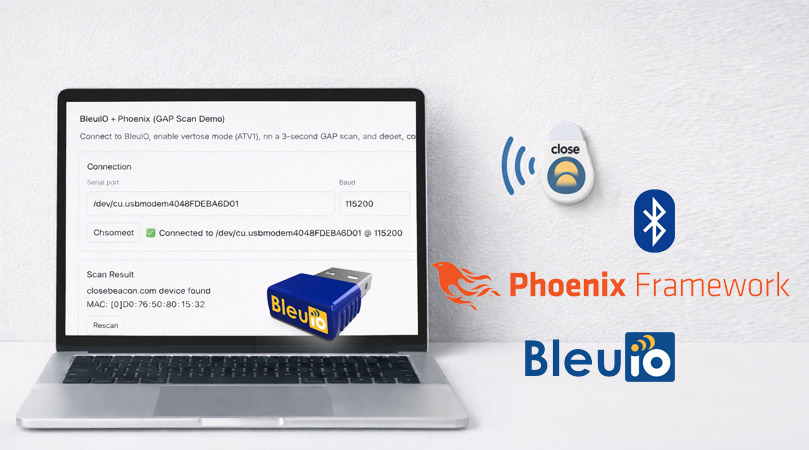
The application connects to a BleuIO USB dongle via a serial port, enables verbose mode, performs a BLE scan, and detects whether a specific nearby BLE device is present. If the target device is found, the application displays its MAC address. This approach is particularly useful for scenarios such as proximity detection, presence monitoring, or gateway-style BLE integrations.
The complete source code for this project is provided separately so developers can easily clone, modify, and build upon it.
Why Phoenix Framework?
Phoenix is a web framework written in Elixir and built on top of the Erlang/OTP ecosystem. It is designed for applications that require high concurrency, real-time updates, and long-running background processes. These characteristics make Phoenix particularly suitable for hardware-integrated applications where continuous communication with external devices is required.
In this project, Phoenix allows the BleuIO serial connection to remain open while BLE scan results are streamed to the web interface. The framework handles process supervision, message passing, and real-time UI updates in a clean and reliable way, without the need for complex front-end JavaScript logic.
How This Differs from a JavaScript-Based Web App
This project does not use the Web Serial API. Web Serial allows browser-based JavaScript applications to access serial devices, but it is primarily intended for interactive, user-driven scenarios. It requires explicit user permission, depends on browser support, and is not suitable for unattended or always-on systems.
By contrast, this Phoenix-based approach keeps all BLE logic on the backend. The web interface simply reflects the current state of the system and allows the user to trigger actions such as connecting or rescanning. This separation makes the application easier to extend, easier to deploy, and more suitable for real-world integrations where reliability and continuous operation are important.
Requirements
To follow this tutorial, you will need:
- A computer
- A BleuIO USB dongle
- A Close beacon
- Elixir and Phoenix installed on your system
How the Application Works
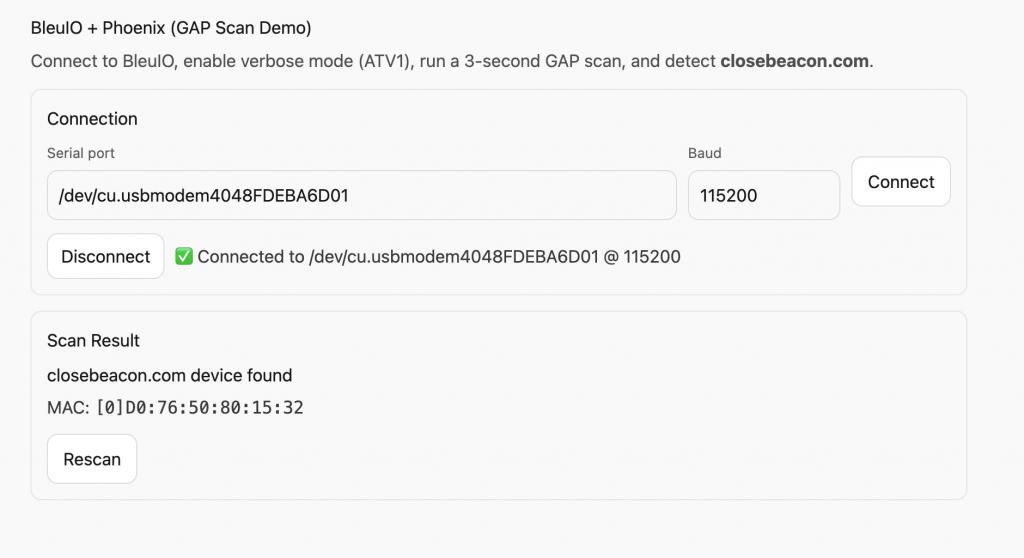
The application follows a straightforward process. The user enters the serial port name where the BleuIO dongle is connected and initiates the connection from the web interface. Once connected, the application sends an AT command to enable verbose mode, making the responses easier to read and parse.
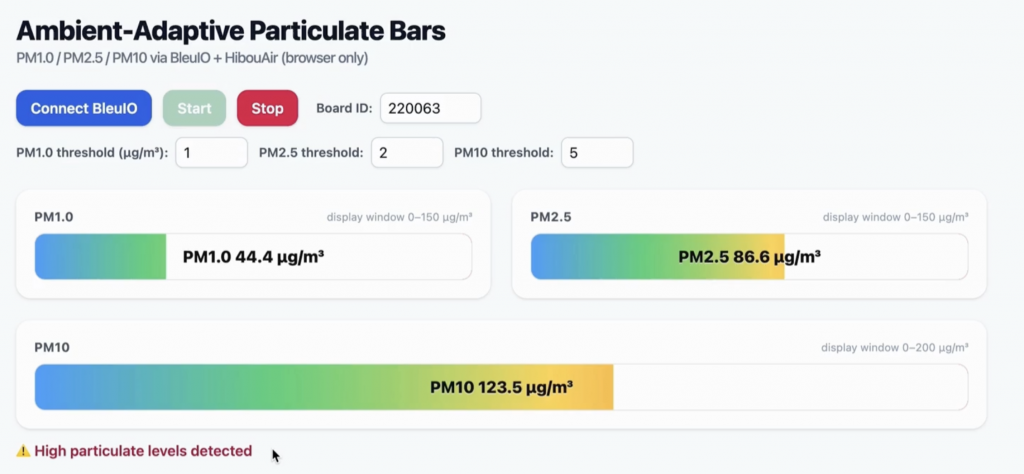
After verbose mode is enabled, the application starts a timed BLE scan. As scan results arrive from BleuIO, they are analyzed in real time. If a BLE device advertising the configured target name is detected, the application extracts its MAC address and updates the interface accordingly. The user can repeat the scan at any time using the rescan option.
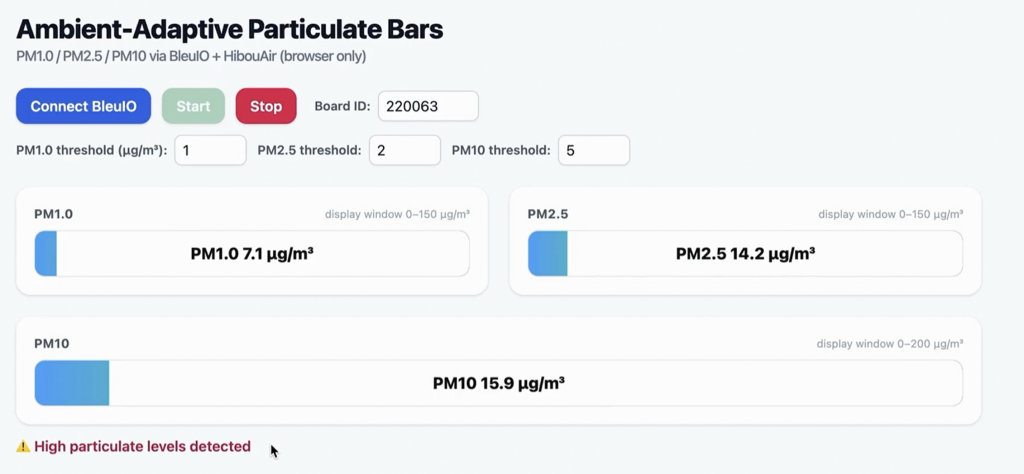
All serial communication and BLE processing run in the background, while the web interface updates automatically based on events generated by the backend.
Running the Application
Installing Phoenix
Phoenix can be installed on macOS using standard tooling for Elixir. Once Elixir is installed, Phoenix can be added using the official project generator. Detailed installation steps are included in the project documentation.
Running the App
Download the source code from https://github.com/smart-sensor-devices-ab/bleuio-phoenix-erlang
After downloading the source code:
- Install dependencies
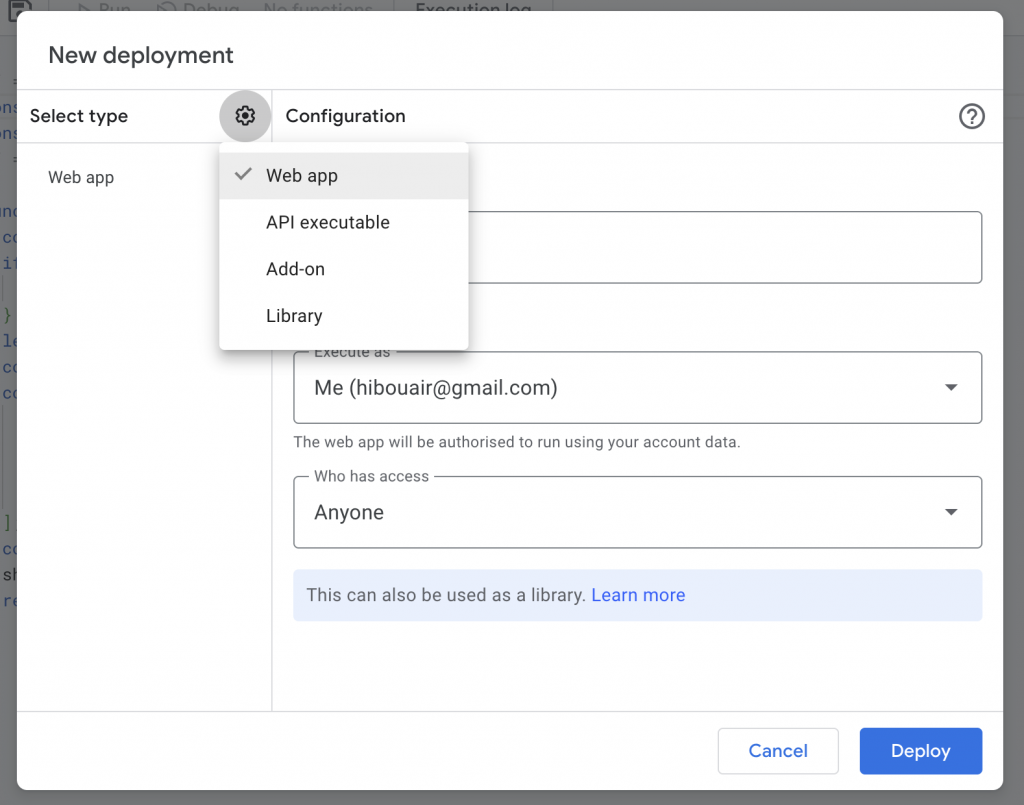
- Start the Phoenix server
- Open the application in a browser
- Enter the BleuIO serial port
- Click Connect
- View scan results and detected devices
Follow README.md for more details
The application runs locally and does not require any cloud services.
Configuring the Serial Port and Target Device
Two key parameters are intentionally easy to modify:
Serial Port
The serial port used by BleuIO can be updated either through the web interface or in the configuration file (config>runtime.exs). This allows the project to run on different machines without code changes.
The serial port name depends on the operating system being used. On macOS, BleuIO typically appears as a device starting with /dev/cu.usbmodem. On Linux systems, the dongle is commonly available as /dev/ttyUSB0 or /dev/ttyACM0, depending on the system configuration. On Windows, BleuIO appears as a COM port, such as COM3 or COM5.
Target BLE Device
The application looks for a specific BLE device name during scanning. This name is defined as a constant in the backend code on lib>bleuio_phx>bleuio_worker.ex and is matched case-insensitively.
Proximity Detection and CloseBeacon Use Case
In the example implementation, the application detects a device advertising the name closebeacon.com. This makes the project suitable for proximity detection use cases, such as presence awareness, zone monitoring, or asset tracking.
BLE beacons like CloseBeacon are commonly used in proximity-based systems, and this project demonstrates how BleuIO can serve as a reliable BLE scanning interface for such applications. More information about CloseBeacon can be found at https://www.closebeacon.com/.
How This Project Helps Developers
This tutorial is intended as an example project rather than a finished solution. It shows how BleuIO can be integrated with a backend web framework to handle BLE scanning in a clean and scalable way. Developers can use this project as a reference to understand the overall architecture and then build their own custom logic on top of it.
The complete source code is provided so that anyone interested can explore the implementation details, experiment with different configurations, and adapt the project for their own BLE-enabled applications.
By combining BleuIO with Phoenix, developers can build BLE-enabled web applications that are not limited by browser APIs or client-side constraints. This example demonstrates a backend-first approach to BLE scanning that is well suited for gateways, monitoring tools, and proximity detection systems.