Bluetooth Low Energy (BLE) has become one of the most widely used wireless technologies for IoT devices, sensors, wearables, and industrial monitoring systems. Developers working with embedded systems, automation platforms, and hardware integration often rely on C++ because of its performance, low-level hardware access, and portability.
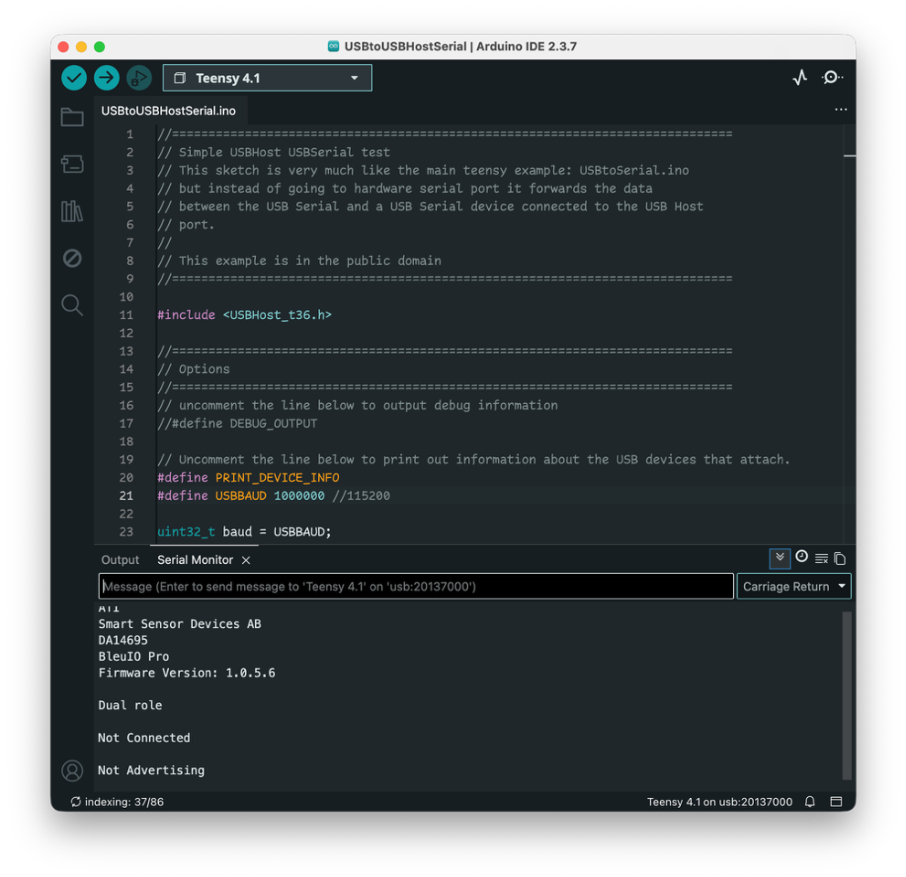
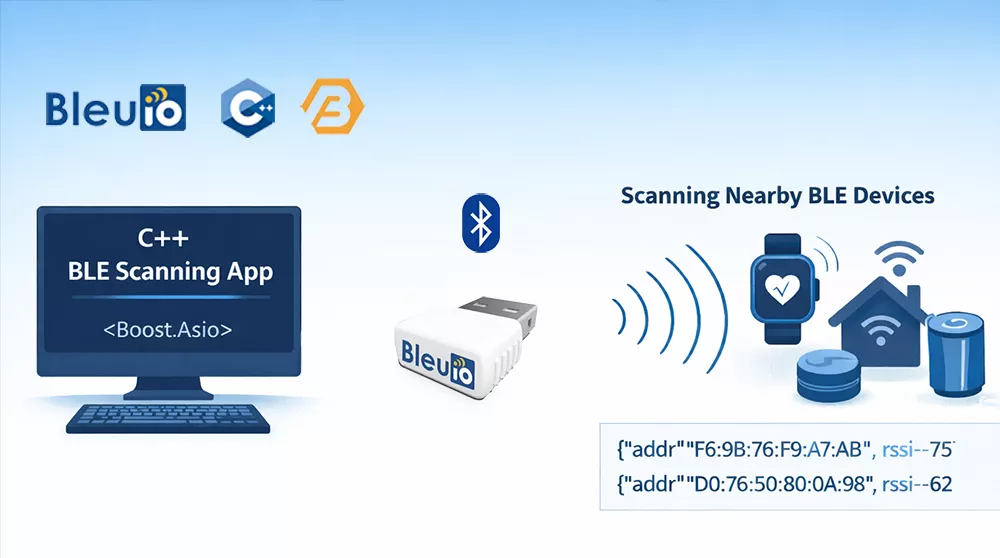
In this tutorial, we will create a simple command-line BLE scanning application using C++. The program connects to the BleuIO USB dongle through a serial port and sends AT commands to control Bluetooth operations. After starting the program, the user enters the number of seconds to scan, and the application instructs the BleuIO dongle to perform a BLE scan and print the detected devices directly in the terminal. This example demonstrates the basic workflow of communicating with BleuIO from a C++ application.
Why C++ and Boost Are Commonly Used for Bluetooth Development
C++ is widely used in Bluetooth and embedded development because it provides high performance and direct access to hardware interfaces such as serial communication. Many IoT gateways, embedded systems, and industrial applications rely on C++ to interact with sensors and wireless devices. To simplify development, developers often use the Boost libraries, which extend the C++ standard library with reliable cross-platform tools. In this tutorial we use Boost.Asio, which provides a portable and efficient way to handle serial communication and asynchronous input/output across different operating systems.
Requirements
Before starting this project, you should have the following:
- A computer running macOS, Windows, or Linux
- A BleuIO USB dongle
- A C++ compiler
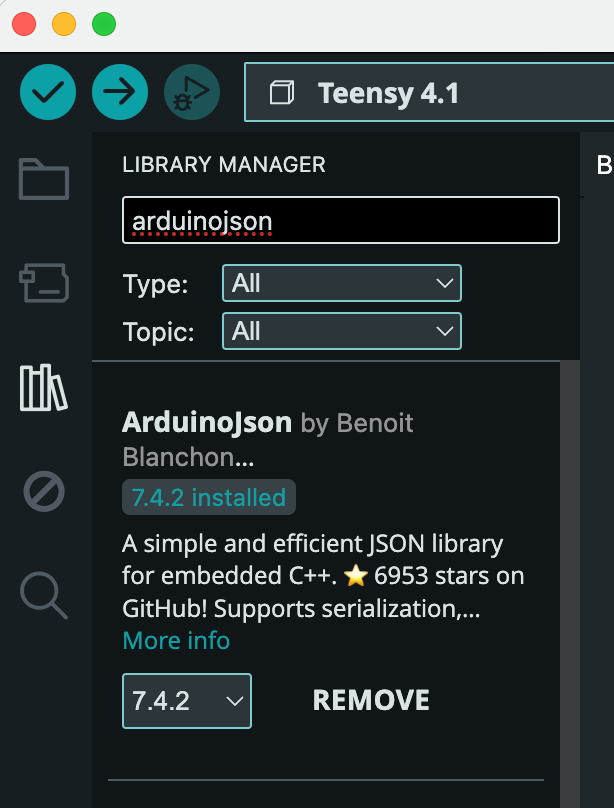
- Boost libraries installed
- Basic knowledge of C++ and terminal commands
Installing the Required Tools
macOS Setup
First install Xcode Command Line Tools, which provide the C++ compiler.
xcode-select --install
Next install Homebrew if it is not already installed.
/bin/bash -c "$(curl -fsSL https://raw.githubusercontent.com/Homebrew/install/HEAD/install.sh)"
Then install Boost:
brew install boost
You can verify the installation using:
brew --prefix boost
Windows Setup
On Windows you will need:
- Visual Studio or MSVC compiler
- Boost libraries
Steps:
- Install Visual Studio Community Edition
- Enable Desktop development with C++
- Download Boost from https://www.boost.org
- Extract Boost and configure it for your project.
Alternatively, Boost can be installed using vcpkg.
Have a look into the getting started guide on boost office page
https://www.boost.org/doc/user-guide/getting-started.html
Understanding How the Script Works
The example script uses Boost.Asio serial communication to interact with the BleuIO dongle.
The application works in several stages.
Serial Connection
The program opens a serial port connected to the BleuIO dongle.
serial_.open(port_name);
The serial port parameters are configured to match BleuIO’s default UART settings.
serial_.set_option(serial_port_base::baud_rate(57600));
serial_.set_option(serial_port_base::character_size(8));
serial_.set_option(serial_port_base::parity(serial_port_base::parity::none));
serial_.set_option(serial_port_base::stop_bits(serial_port_base::stop_bits::one));
serial_.set_option(serial_port_base::flow_control(serial_port_base::flow_control::none));
Asynchronous Serial Reader
The script uses an asynchronous reader to continuously listen for responses from the BleuIO dongle.
serial_.async_read_some(...)
Whenever the dongle sends data, the program prints the received information to the terminal.
This allows us to see scan results in real time.
Sending AT Commands
Commands are sent to BleuIO using the sendCommand() function.
bleuio.sendCommand("AT+CENTRAL");
The command is written to the serial port followed by a carriage return and newline.
Setting Central Role
BLE devices can operate in different roles.
Before scanning, the BleuIO dongle must be set to central mode.
bleuio.sendCommand("AT+CENTRAL");
Starting a BLE Scan
The scan command is then issued.
AT+GAPSCAN=<seconds>
For example:
AT+GAPSCAN=5
This instructs the BleuIO dongle to scan for nearby BLE devices for five seconds.
The dongle returns advertising data for detected devices during the scan.
Full Source Code
You can find the full source code on GitHub.
GitHub repository
https://github.com/smart-sensor-devices-ab/bleuio-cpp-boost
The repository contains the complete C++ script used in this tutorial.
How to Run the Script
First compile the program.
clang++ -std=c++17 main.cpp -I$(brew --prefix boost)/include -o bleuio_scan
After compilation, run the program:
./bleuio_scan
The program will ask for the scan duration.
Example:
Enter scan duration in seconds: 5
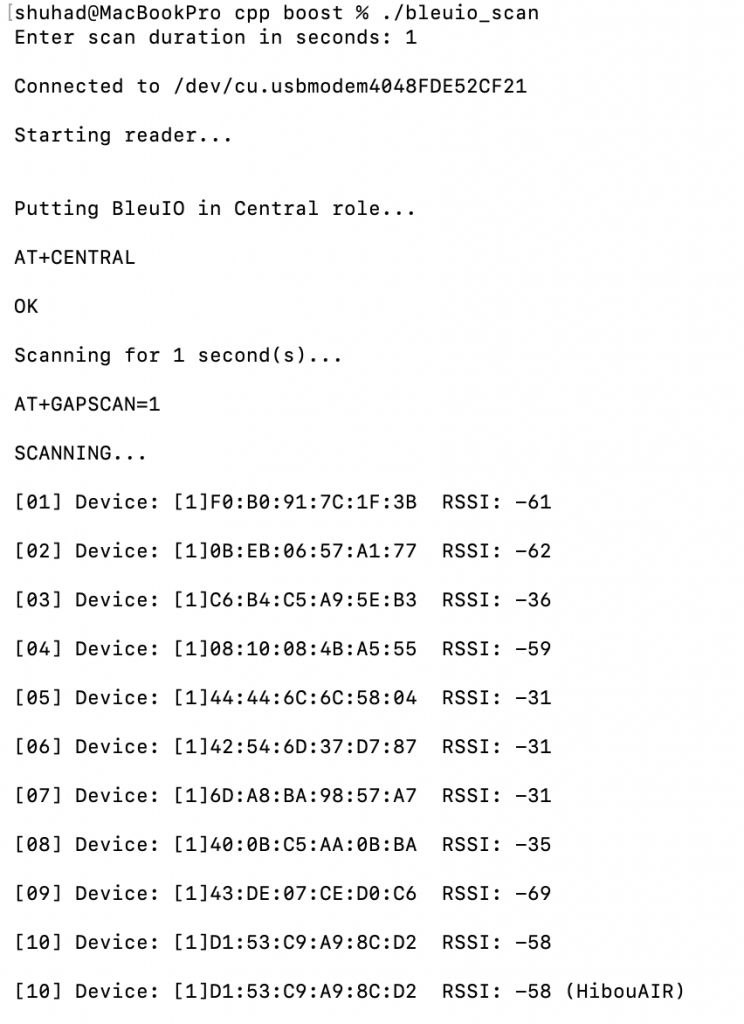
The script will then:
Connect to the BleuIO serial port,Put the dongle into central mode,Start scanning for BLE devices,Print scan results in the terminal
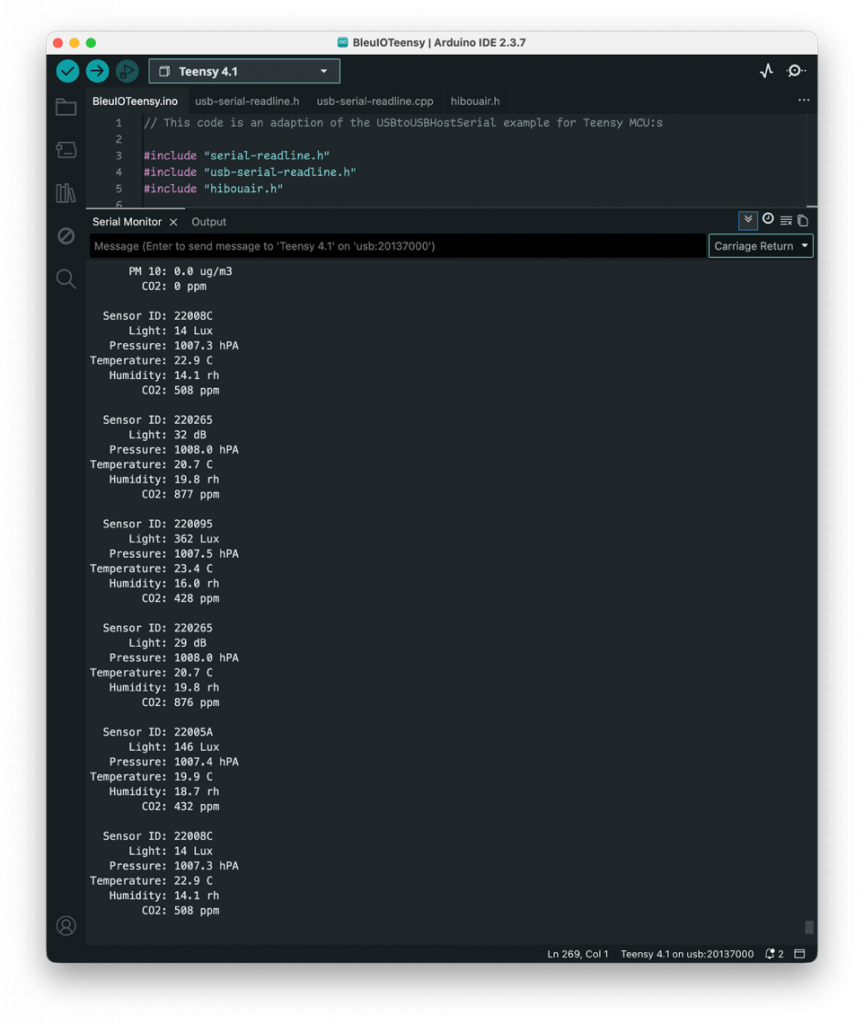
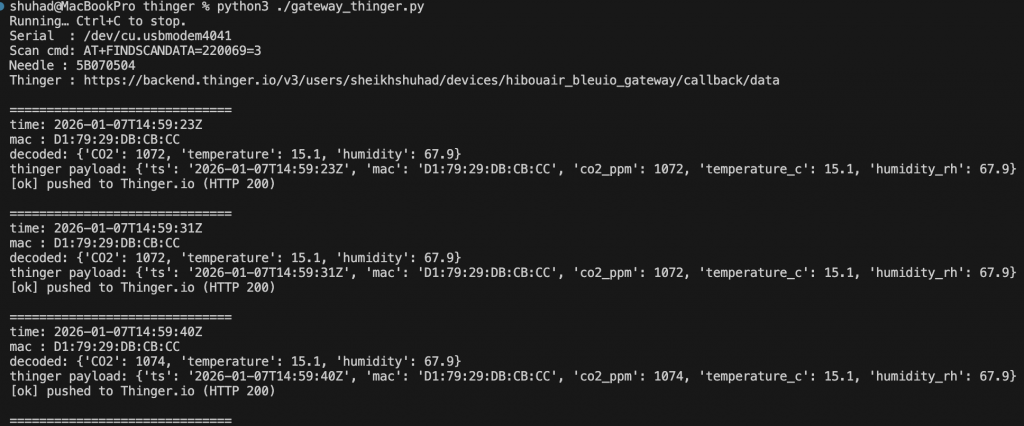
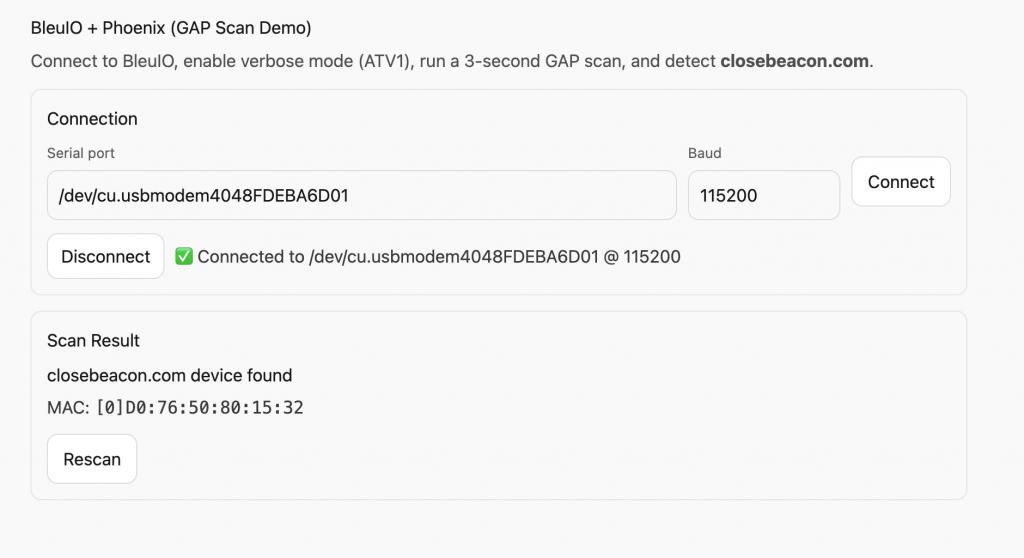
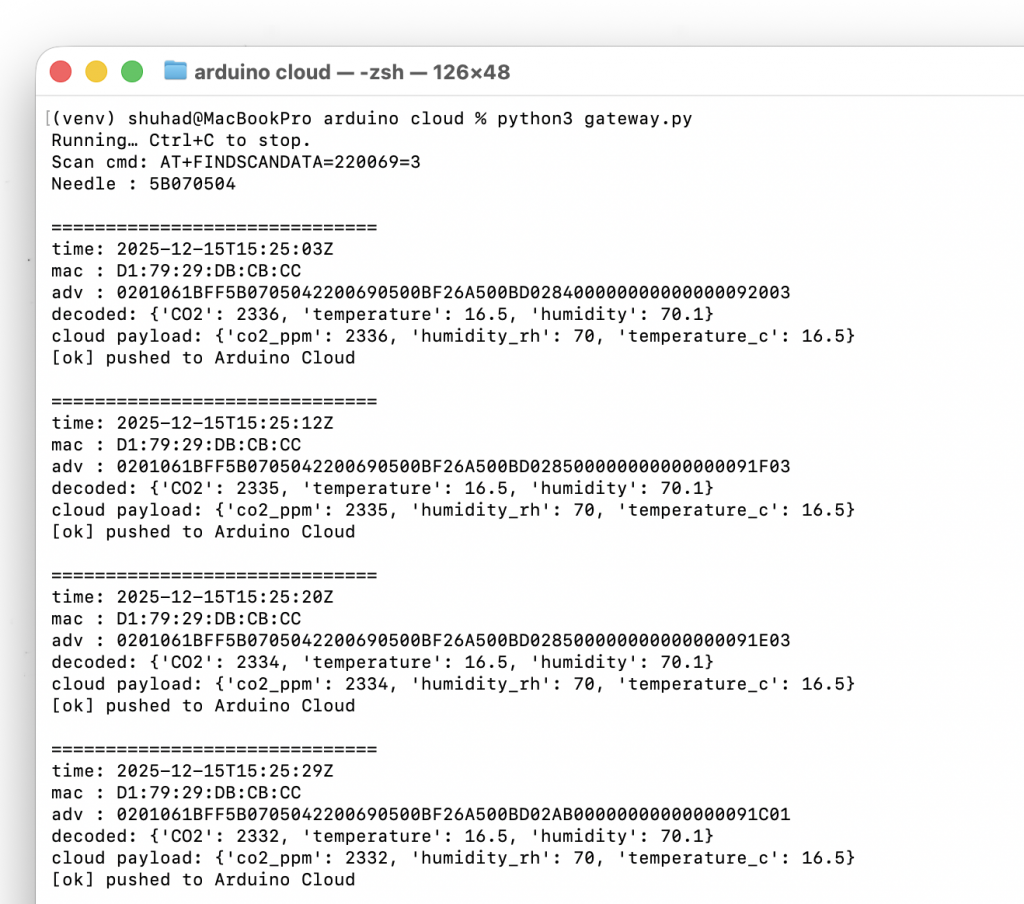
Example output may look like this:
Locating the BleuIO Serial Port
Before running the program, you need to identify the serial port where the BleuIO dongle is connected.
On macOS, you can list available serial devices using the terminal command:
ls /dev/cu.*
The BleuIO device will typically appear with a name similar to:
/dev/cu.usbmodemXXXXXXXX
This value can then be used in the script as the serial port path.
On Windows, the serial port can be identified through Device Manager. After plugging in the BleuIO dongle, open Device Manager and expand the Ports (COM & LPT) section. The device will appear as a USB serial device with a COM port number, such as COM17.
Expanding This Example
The script in this tutorial is a basic example showing how to communicate with the BleuIO dongle using C++ and Boost.Asio. Although it only performs BLE scanning, the same approach can be used to send any AT command supported by BleuIO. Developers can extend this example to connect to devices, read GATT characteristics, parse advertisement data, or integrate BLE functionality into larger applications such as IoT gateways, monitoring tools, or automation systems.