Build a BLE Signal Strength Analyzer with Live Charts Using BleuIO, Python and Plotly
November 4, 2026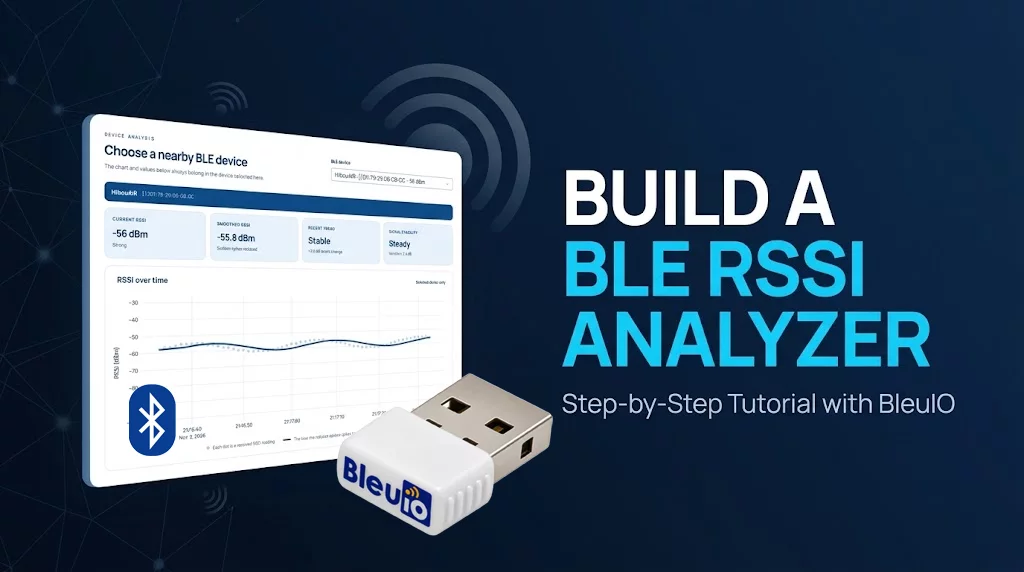
RSSI analysis becomes much easier when you can see the signal changing instead of watching a stream of numbers in a terminal. A chart makes it possible to notice movement, sudden drops, periods of instability, and differences between devices almost immediately.
In this project, we use a BleuIO USB dongle with Python and Plotly Dash to build a live BLE signal strength analyzer. The application scans nearby BLE advertisers, lets us select a device, and follows its RSSI over time. It also provides a quick overview of every device currently being discovered.
This is intended as a starting point rather than a complete positioning or ranging system. If you already work with RSSI, the dashboard gives you a practical base for collecting observations, testing an environment, and extending the analysis for your own use case.
What the analyzer provides
The dashboard is organized around one selected BLE device. Its current RSSI, smoothed RSSI, recent trend, and signal stability appear directly above a live time-series chart. The raw readings remain visible, so the processed line never hides what the dongle actually received.
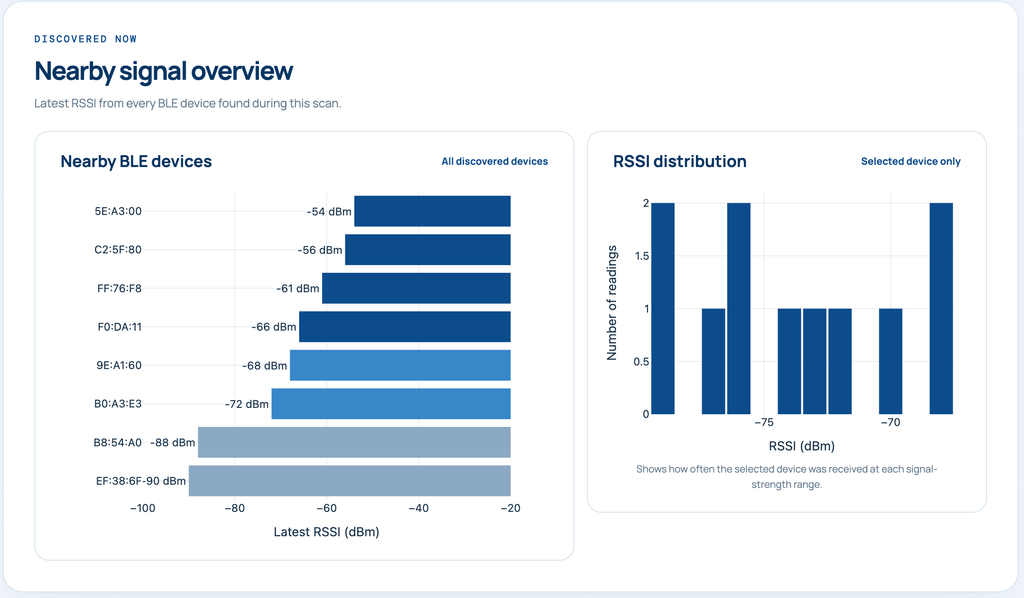
Below the main analysis, the Discovered Now section compares the latest RSSI values from nearby devices. An RSSI distribution chart shows how the selected device’s readings are spread across the recent observation window.
This combination is useful when you want to answer practical questions such as whether a signal is consistently weak, whether it is changing direction, or whether an apparently stable device is producing occasional large variations.
Hardware and software
You will need:
- A BleuIO USB dongle
- Python 3.10 or newer
- The project source code on GitHub
The application uses pySerial to communicate with BleuIO and Plotly Dash for the local dashboard. BleuIO handles the BLE radio operation, so the Python application only needs to work with its serial AT-command interface.
Download and install the project
Clone the repository and move into the project directory:
git  clone  https://github.com/smart-sensor-devices-ab/bleuio-rssi-analyzer.git

cd  bleuio-rssi-analyzer
On macOS or Linux, create a virtual environment and install the dependencies:
python3  -m  venv  .venv

source  .venv/bin/activate

python  -m  pip  install  -r  requirements.txt
On Windows PowerShell, use:
py -m venv .venv

.venv\Scripts\Activate.ps1

python -m pip install -r requirements.txt
Connect the BleuIO dongle before starting the application. BleuIO briefly exposes its bootloader after power-up, so allow approximately 15 seconds for the normal application serial port to appear.
Start the analyzer:
python app.py
Then open http://127.0.0.1:8050 in a browser.
Start scanning
The serial-port menu only shows ports identified as BleuIO devices. On macOS, this normally looks like /dev/cu.usbmodem.... On Windows, the dongle may appear as a generic USB Serial Device (COMx), so the application also recognizes BleuIO by its USB vendor and product identifiers.
Select the dongle and click Start scan. The application places BleuIO in central role and repeatedly performs a short timed scan using AT+GAPSCAN=1. Repeating the timed scan gives the dashboard a continuing series of fresh RSSI observations instead of a single discovery result. The command behavior is documented in the BleuIO AT command reference.
As advertisements are received, nearby addresses appear in the BLE device menu. Select the device you want to examine, and the analysis area updates immediately.
Follow a selected signal
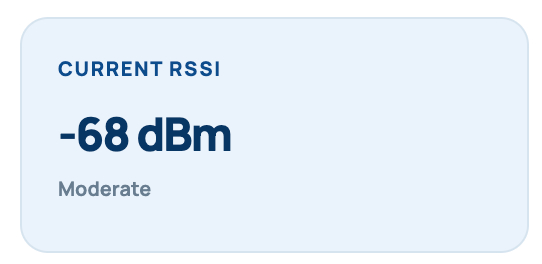
The Current RSSI card displays the most recent reading. This value is useful for immediate feedback, but normal radio variation can make it jump even when neither device has deliberately moved.
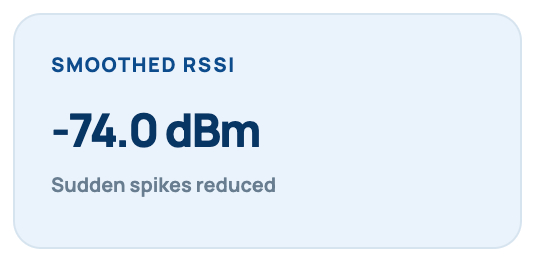
The Smoothed RSSI view makes the overall movement easier to follow. The project first applies a short median filter to reduce isolated spikes, followed by an exponentially weighted moving average that gives more importance to recent observations. The original samples remain visible as dots, while the smoothed result appears as the blue line.
This processing is deliberately lightweight. It is enough to make the live chart readable, but it is also easy to replace if your experiment needs a Kalman filter, a different smoothing window, or no filtering at all.
Read the trend and stability indicators
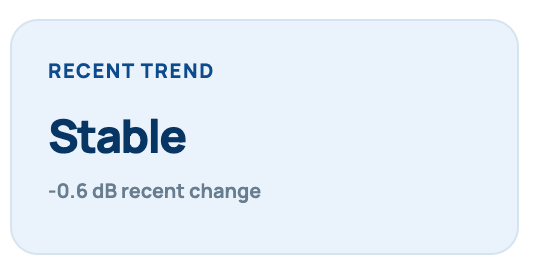
The Recent Trend card compares the latest smoothed value with the recent signal history. A change of at least 4 dB is described as Getting stronger or Getting weaker. Smaller changes are shown as Stable. The card also displays the measured change, making the label easy to interpret rather than presenting it as an unexplained classification.
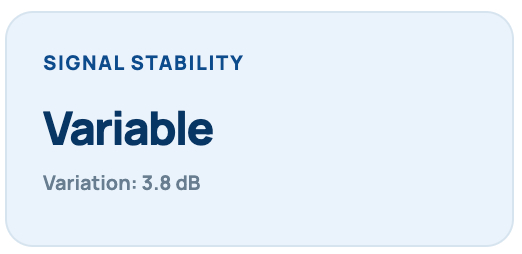
The Signal Stability card looks at the variation among the latest raw readings. A tightly grouped signal is labeled Steady. Greater variation is reported as Variable or Unstable. Strength and stability are treated separately: a weak signal can still be steady, and a strong signal can fluctuate considerably.
These thresholds are sensible defaults for exploring a signal, not universal BLE rules. They are kept in a small analysis module so they can be adjusted for the advertising interval, environment, antenna, and behavior of the device being studied.
Compare nearby devices
The Discovered Now chart provides context for the focused analysis. It shows the latest RSSI from every address found during the scan, ordered from stronger to weaker signals. This is useful when choosing a target or checking how crowded the local BLE environment is.
The distribution beside it belongs only to the selected device. It counts how often recent readings occurred within each RSSI range. A narrow group of bars usually accompanies a steadier signal, while a wider spread reveals more variation. The chart can be especially useful when comparing two locations or antenna orientations that have a similar average RSSI but different consistency.
Try a simple observation
Choose a BLE advertiser that sends packets regularly and leave it in a fixed position. Let the analyzer collect readings for a short period, then change one condition at a time: rotate the device, move it farther away, place an obstacle between it and BleuIO, or walk through the signal path.
The raw samples show the immediate radio response. The smoothed line makes the larger movement easier to see, while the trend and stability cards provide a compact summary. The distribution shows whether the new condition changed only the average signal or also made it more variable.
The goal is not to turn RSSI into an exact ruler. Bluetooth radio measurements are affected by the environment, reflections, antenna orientation, and the human body. The Bluetooth SIG notes that newer Bluetooth Channel Sounding is more reliable for accurate ranging than approaches that use RSSI as a distance proxy. The Bluetooth Low Energy primer provides useful background on that distinction.
For this project, RSSI is used for what it does well: observing relative signal behavior, detecting meaningful changes, and building an experiment around real measurements.
Take the project further
The source is intentionally compact so it can be adapted. A next version could save readings to CSV, compare multiple selected devices, add experiment markers, calculate packet reception rates, or load a calibration profile for a known environment. The analysis functions can also be replaced without changing the BleuIO serial scanner or the dashboard structure.
You can find the complete application, installation instructions, and tests in the BleuIO RSSI Analyzer repository.
With a live view of both raw and processed RSSI, the project turns BleuIO into a useful signal exploration tool—and a practical foundation for more focused BLE research.