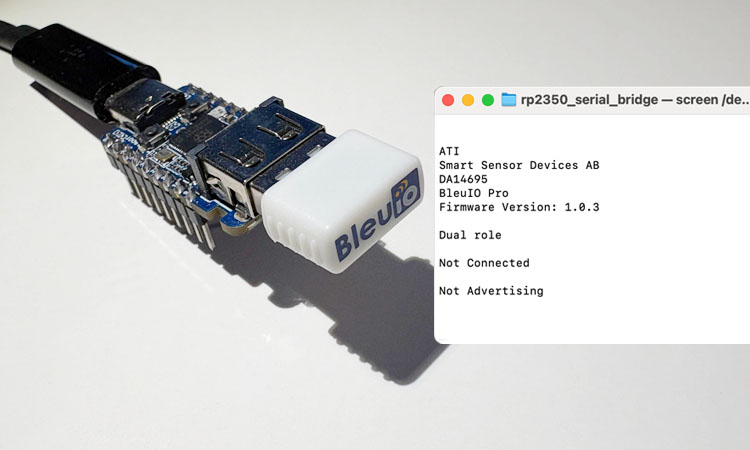
In this tutorial, we demonstrate how to connect the BleuIO Bluetooth Low Energy dongle to the Waveshare RP2350A USB Mini development board to create a dual-mode USB serial bridge. This example highlights the process of communicating with BleuIO using AT commands via USB host mode. It serves as a great starting point for anyone looking to build their own BLE application using this compact and powerful board.
About the Waveshare RP2350A USB Mini
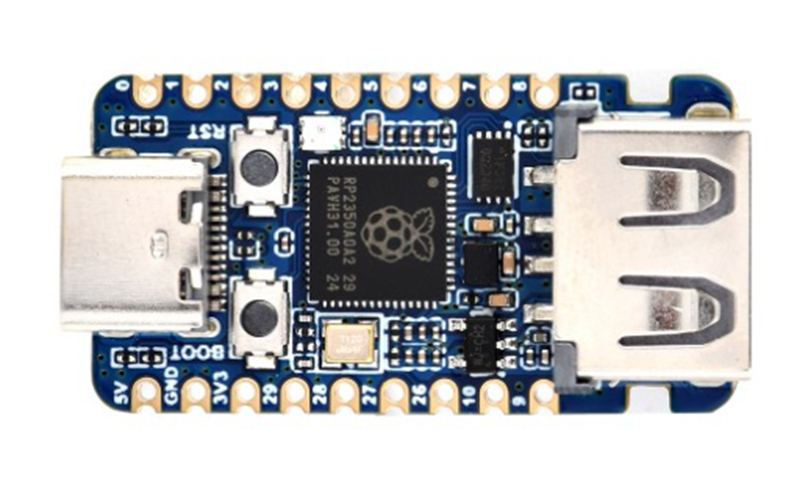
The Waveshare RP2350A USB Mini is a development board built around the Raspberry Pi RP2350 microcontroller. It features a dual-core architecture, combining ARM Cortex-M33 and RISC-V Hazard3 cores, running at up to 150 MHz. The chip includes 520KB of SRAM and 2MB of onboard flash, making it suitable for advanced embedded applications.
What sets this board apart is its USB-A connector with support for USB host mode, allowing it to communicate directly with USB peripherals like the BleuIO dongle. This makes it an ideal host controller for Bluetooth Low Energy (BLE) applications.
Project Overview
This project demonstrates a dual-mode USB serial bridge implemented on the RP2350A board. The bridge allows the board to simultaneously function as:
A USB host using PIO-USB on GPIO 12/13, connected to a device like BleuIO.
A USB device, appearing as a virtual COM port when connected to a PC.
Data is transparently forwarded between the host and device interfaces, allowing you to communicate with BleuIO from a terminal on your PC.
This example project is useful for anyone looking to build a standalone USB host application using BleuIO. You can use the source code as a base and expand it into a more complex BLE project by sending and receiving AT commands directly from the RP2350A board.
Use Case
Imagine a scenario where you want to build a small, embedded BLE sensor gateway. Using the RP2350A as a USB host and BleuIO as the BLE interface, you can develop a powerful BLE solution without needing a full-sized computer. This approach is ideal for prototyping custom BLE applications, sensor data acquisition, or even building a mini BLE scanner.
In host mode, the RP2350 board uses PIO-USB to emulate USB host functionality on GPIO pins 12 (D+) and 13 (D-). You can connect any CDC-compatible device, such as a USB-to-serial adapter or the BleuIO dongle, to these pins.
Once connected, the application automatically detects and configures the device. All incoming and outgoing serial data is forwarded and can be monitored through the debug UART interface.
Device Mode (Native USB Port)
When the RP2350A’s native USB port is connected to your PC, it appears as a virtual serial port. This allows you to communicate with the BLE dongle (connected via host mode) using a terminal application like PuTTY or Tera Term.
This enables full-duplex communication, letting you send AT commands to BleuIO and receive responses directly from your PC.
Debug Output (UART on GP0/GP1)
To observe internal debug messages, connect a UART adapter to GPIO 0 (TX) and GPIO 1 (RX) with a baud rate of 115200. This output includes information such as device enumeration, data flow, and potential errors—essential for troubleshooting and development.
Building the Project
To build the firmware, you can either use the provided build script or follow a manual setup.
You can find the complete source code for this project on GitHub:
mkdir build && cd build
cmake .. -DCMAKE_BUILD_TYPE=Release
make -j4
After building, a rp2350_serial_bridge.uf2 file will be generated.
Flashing the Firmware
Hold the BOOTSEL button on the RP2350 board and connect it to your PC via USB.
The board will mount as a USB mass storage device.
Copy the generated rp2350_serial_bridge.uf2 file to this drive.
The board will reboot and start running the dual-mode USB bridge application.
You can now insert the BleuIO dongle into the USB-A port of the RP2350A board and begin communication from your PC.
Code Structure
main.c – Main entry point of the application.
serial_host_bridge.c/h – Handles the USB CDC host implementation.
tusb_config.h – TinyUSB configuration file.
CMakeLists.txt – Build configuration for CMake.
Getting Started with Your Own BLE App
This project is just a starting point. It demonstrates how to set up USB host/device mode and communicate with a CDC-based USB dongle like BleuIO. From here, you can extend the code to parse responses, interact with BLE devices, or trigger actions based on received data.
By combining the flexible RP2350A platform with BleuIO, developers can create their own powerful standalone BLE applications for IoT, sensors, or industrial control—without relying on a full computer.
Source Code
You can find the complete source code for this project on GitHub:
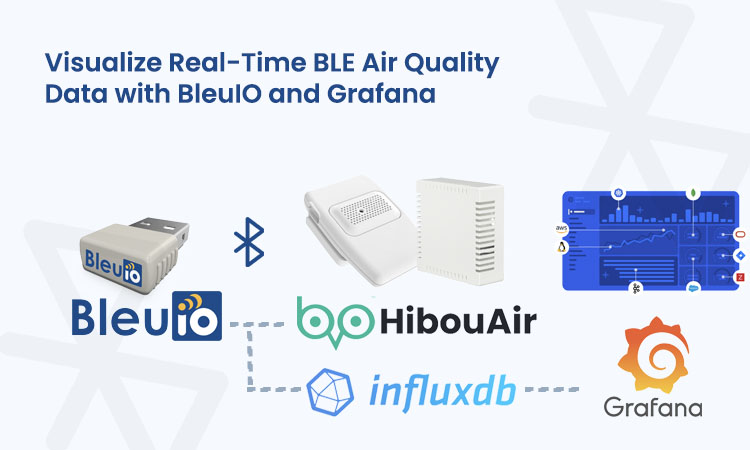
Indoor air quality is an important factor in workplace health, home comfort, and industrial safety. Monitoring CO2, particulate matter, temperature, humidity, and other environmental metrics can help prevent health issues, optimize HVAC usage, and maintain compliance with building standards. In this tutorial, we’ll walk through building a complete air quality monitoring solution using the BleuIO USB dongle and the HibouAir BLE sensor. We’ll use Python to collect data, InfluxDB to store it, and Grafana to visualize it in real time.
This project works entirely offline, runs on both macOS and Windows, and is suitable for personal, educational, or professional use. Whether you want to monitor a home office or manage sensors in an industrial setup, this system is simple to deploy and easy to scale.
What You Need
You will need one BleuIO USB dongle and one HibouAir BLE sensor. These two devices form the core of the setup. The BleuIO dongle will connect via a serial port and act as a BLE Central, continuously scanning for BLE advertisement packets sent by the HibouAir sensor.
For software, you’ll need Python 3, InfluxDB, and Grafana, all of which are available for both macOS and Windows. You’ll also install a few Python packages (pyserial and influxdb) to allow your script to read data over the serial port and write it to the database.
About Grafana
Grafana is an open-source analytics and visualization platform designed to display time-series data. It integrates seamlessly with databases like InfluxDB, allowing users to create interactive and customizable dashboards. In this project, Grafana serves as the front end for visualizing live air quality data coming from the HibouAir sensor. Its intuitive interface and support for powerful queries make it ideal for monitoring environmental conditions over time, setting alerts, and gaining actionable insights from BLE sensor data.
macOS Installation
On macOS, it’s easiest to install tools using Homebrew. You can install everything with the following commands:
Make sure Python and pip are added to your system path. You can then install Python packages via:
pip install pyserial influxdb
Also, identify your BleuIO COM port by opening Device Manager and checking Ports (COM & LPT). You’ll see something like COM3, which you’ll use in the Python script.
Setting Up InfluxDB
After installing InfluxDB, you need to create a database that will store sensor readings. On macOS, open your terminal. On Windows, use Command Prompt or PowerShell.
To enter the InfluxDB CLI:
influx
Inside the CLI, run:
> CREATE DATABASE hibouair
> SHOW DATABASES
> EXIT
This creates a database called hibouair, which your Python script will use to log environmental data.
You don’t need to set up authentication for local testing. If you do secure your instance later, remember to update Grafana and the Python script with your username and password.
Configuring Grafana
Once Grafana is installed and running, open your browser and go to:
http://localhost:3000
The default username and password are:
Username: admin
Password: admin
After logging in, you’ll be asked to set a new password. Once you’re in the Grafana dashboard:
Go to Settings → Data Sources
Click Add data source
Choose InfluxDB
Set the following:
URL: http://localhost:8086
Database: hibouair
User and Password: leave empty unless you’ve enabled authentication
HTTP Method: GET or POST (default is fine)
Click Save & Test
You should see a success message confirming Grafana can read from InfluxDB.
Connecting BleuIO via Serial Port
Insert your BleuIO USB dongle.
On macOS, find the port using: ls /dev/cu.usbmodem* Example: /dev/cu.usbmodem4048FDEBA6D01
On Windows, check Device Manager → Ports (COM & LPT) and find something like COM3 or COM4.
This port will be used in your Python script to open a serial connection to the dongle.
The Python Script
The Python script initializes the BleuIO dongle in Central mode, sends a scan command (AT+FINDSCANDATA), and reads the BLE advertisement packets from the HibouAir sensor. The data, which arrives in hexadecimal format, is decoded to extract values like temperature, humidity, CO2, VOC, PM1, PM2.5, PM10, light, noise, and pressure. The script then writes this data to InfluxDB with a timestamp.
To avoid storing duplicate values, the script only logs the first valid reading per scan cycle. It waits for a configurable period (e.g., 20 seconds) before scanning again.
You can view and copy the complete Python script from the GitHub repository linked below.
Make sure to replace the serial port path and board ID in the script with your actual values.
Creating a Dashboard in Grafana
With data flowing into InfluxDB, it’s time to visualize it in Grafana. Start by creating a new dashboard:
From the left menu, go to Dashboards → New → Add new panel
In the query editor, select your InfluxDB data source
Enter the following query to display CO2 levels: SELECT last("co2") FROM "air_quality" WHERE $timeFilter GROUP BY time($__interval)
This query fetches the latest CO2 readings from the air_quality measurement. You can change "co2" to "temp", "hum", "voc", "pm25" or any other field depending on what you want to display.
Grafana will automatically plot the data on a line chart. You can switch to a gauge, bar, or other visualizations from the panel settings. You can also set thresholds, value ranges, and colors to improve readability.
Repeat this process to add more panels for temperature, humidity, VOCs, PM2.5, PM10, and other values.
Once your dashboard is complete, click Apply, then Save the dashboard to reuse it later.
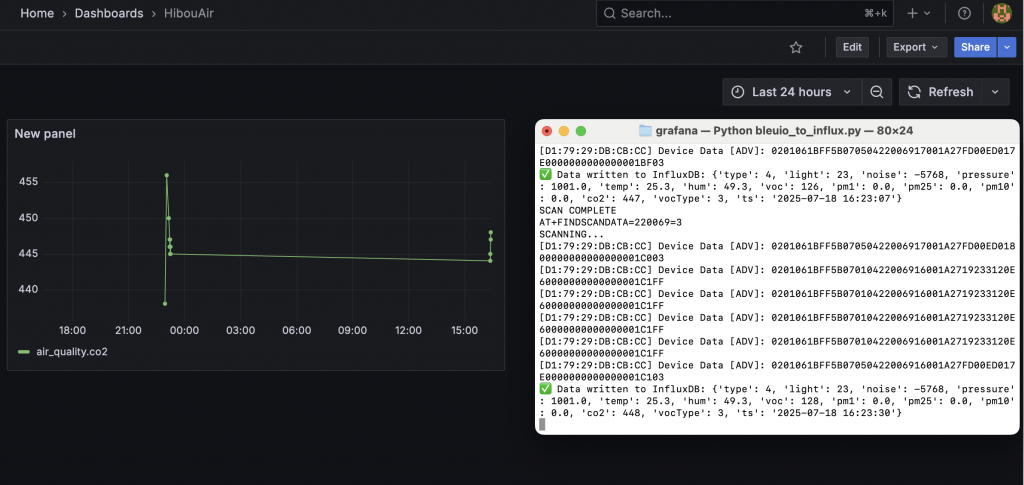
Output
How It Works
This system leverages BLE advertisement broadcasting from HibouAir and AT command-based serial communication with the BleuIO dongle. The dongle scans for a specific board ID using AT+FINDSCANDATA=<board_id>=3, and the Python script reads and decodes each advertisement received. The decoded data is immediately sent to InfluxDB using the official client library.
Grafana queries this time-series data and displays it in real time. Since all components are local, there is no dependency on external servers or cloud APIs. The system is also modular, so you can easily scale it to support multiple sensors, extend the decoder for other BLE formats, or forward data to cloud-based platforms in the future.
Use Cases
This setup is ideal for a range of applications. In an office environment, monitoring CO2 and humidity can help optimize ventilation and improve productivity. In factories or workshops, tracking particulate matter and VOCs ensures air quality compliance and safety. For researchers and students, this project provides a hands-on, local, and open-source method to study environmental changes. Even in residential settings, it can help detect poor air circulation or pollutant spikes. The simplicity of this solution makes it accessible to both developers and non-developers alike.
Extending the Project
There are several ways to expand this project:
Add support for additional BLE data types, such as HibouAir’s type 08 advertisements for NO₂
Set up Grafana alerts to notify you when CO2 exceeds 800 ppm or humidity drops below 30%
Export historical data from InfluxDB to CSV for offline analysis
Run the Python script as a background service on system boot
Connect multiple sensors to cover multiple rooms or areas
With minimal changes, you can also run this setup on a Raspberry Pi or Linux server.
With just a BleuIO dongle, a HibouAir sensor, and a few open-source tools, you’ve built a fully functional air quality monitoring solution. The system is flexible, lightweight, and runs entirely offline. It provides real-time insights into indoor environmental conditions and can be adapted for a variety of applications.
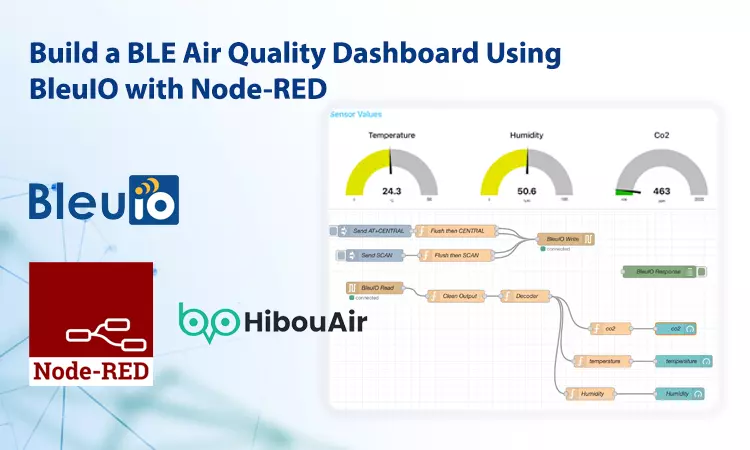
Node-RED, a flow-based development tool for visual programming, has become a favorite among IoT developers for rapidly building and testing automation workflows. In this article, we explore how to use BleuIO, a Bluetooth Low Energy (BLE) dongle, within Node-RED to interact with BLE devices like HibouAir—an affordable and reliable air quality monitoring sensor.
We will demonstrate:
How to send BLE commands to BleuIO and read back data
How to scan for BLE advertisements from a HibouAir device
How to decode and display real-time air quality data like CO2, temperature, and humidity on a live dashboard
By the end, you’ll have a working Node-RED BLE setup using BleuIO and a HibouAir sensor.
What is Node-RED?
Node-RED is an open-source, flow-based programming tool built on Node.js. It offers a browser-based visual interface that allows developers to connect hardware devices, APIs, and services using prebuilt “nodes.” Originally developed by IBM, Node-RED has grown into one of the most accessible platforms for prototyping and building IoT and automation solutions.
What makes Node-RED especially appealing is its simplicity. Without needing to write complex code, developers can drag and drop logic blocks and wire them together to build powerful flows. It supports a wide range of protocols, including MQTT, HTTP, and—through serial communication. With its real-time data handling, debugging tools, and powerful dashboard feature, Node-RED becomes an ideal choice for BLE-based IoT projects like this one.
What is HibouAir?
HibouAir is a compact and affordable air quality monitoring device developed by Smart Sensor Devices. Designed for both indoor and outdoor use, it transmits real-time environmental data over Bluetooth Low Energy (BLE), making it easy to integrate into any smart environment. The sensor measures key air quality parameters such as CO2, temperature, humidity, particulate matter (PM1.0, PM2.5, PM10), VOCs, light intensity, noise levels etc. This simplicity makes it a perfect fit for developers and system integrators working with platforms like Node-RED, where data can be read, decoded, and visualized in minutes.
What We Built
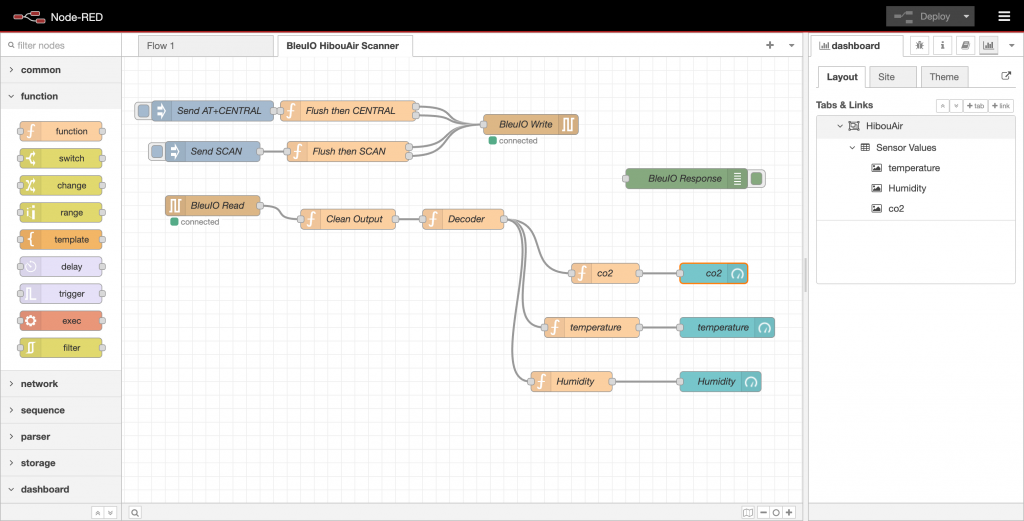
We built a flow in Node-RED that:
Sends an AT command to put BleuIO in central role (AT+CENTRAL)
Sends a scan command to search for HibouAir devices (AT+FINDSCANDATA)
Reads the advertisement data from a known board ID (e.g., 220069)
Decodes the BLE hex payload using a custom decoder function
Extracts and displays live air quality values (CO2, temperature, humidity) in the dashboard
Requirements
To replicate this project and visualize air quality data using Node-RED and BleuIO, you’ll need the following hardware and software:
BleuIO Dongle
A plug-and-play USB Bluetooth Low Energy (BLE) dongle that supports AT commands over serial. Get BleuIO
HibouAir Sensor
An affordable air quality monitoring device that broadcasts environmental data via BLE advertisements. Get HibouAir
Node-RED
A low-code flow-based development tool to wire together devices, APIs, and services. Node-RED Installation Guide
Tip: You can install Node-RED globally via npm:
npm install -g --unsafe-perm node-red
Node-RED Dashboard
An additional Node-RED module used to create UI dashboards. Dashboard GitHub Repo Install it with:
cd ~/.node-red
npm install node-red-dashboard
HibouAir Decoder Script
A Node.js-based decoding script that extracts sensor values from BLE advertisement data.
A serial in node reads back raw BLE advertisements. These are filtered and passed through a custom decoder only if they match a specific prefix like 5B0705 and contain the HibouAir board ID.
3. Decode Payload
We placed a hibouair-decoder.js script next to settings.js and loaded it globally using:
The decoder function parses the hex payload into human-readable sensor values.
4. Show on Dashboard
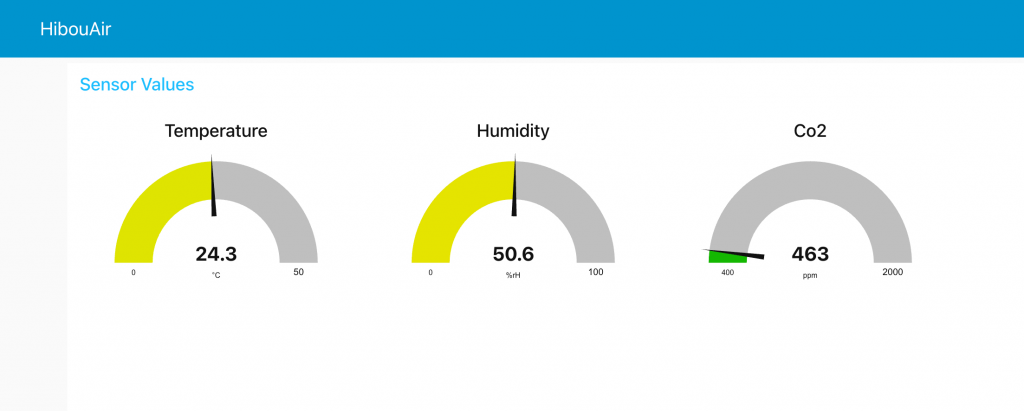
Finally, we use dashboard gauge widgets to show live values:
CO2 in ppm
Temperature in °C
Humidity in %RH
The Node-RED dashboard UI gives a beautiful, real-time snapshot of your air quality.
Live Dashboard
Live readings of CO2, temperature, and humidity.
A snapshot of the working Node-RED flow using BleuIO and HibouAir.
Use Cases
This solution opens doors for a wide variety of applications. In smart classrooms, it ensures students learn in environments with healthy air quality, which can significantly affect concentration and wellbeing. In modern office spaces, monitoring CO2 and temperature helps facilities maintain optimal working conditions, improving both productivity and comfort.
For developers and researchers, this integration offers an easy way to prototype BLE applications, decode custom advertisements, and visualize data with minimal setup. Environmental agencies or facility managers can use this same setup for on-site testing and audits without needing cloud connectivity.
Even at home, you can deploy this as a DIY setup to monitor indoor air conditions and get real-time alerts when CO2 levels get high due to poor ventilation.
What You Can Do Next
Now that you have a live setup showing CO2, temperature, and humidity from HibouAir on a Node-RED dashboard, the possibilities for extending this flow are endless.
To store and track trends, you can add a chart node that logs values over time. This enables historical analysis of indoor air conditions, which is useful for compliance, optimization, or just awareness.
If you’re concerned about thresholds, consider adding a switch node that triggers alerts—say, if CO2 levels rise above 1000 ppm or the temperature exceeds 30°C. This could be used to turn on ventilation or send a mobile notification.
You might also want to persist data to a local SQLite database or forward readings to a cloud-based API for further processing or sharing. This transforms your flow into a powerful edge gateway.
Finally, you can export the complete flow as a template, allowing colleagues, customers, or community users to import it directly and start monitoring with their own HibouAir and BleuIO setup.
Try It Yourself
You can import the full Node-RED flow here and start using it with:
Just install Node-RED, load this flow, and you’ll start seeing real-time air quality readings in your browser dashboard.
This tutorial shows how BleuIO seamlessly integrates with platforms like Node-RED to help developers quickly build BLE-powered applications. Combined with a device like HibouAir, this setup makes monitoring air quality simple, affordable, and accessible—without any advanced hardware or coding requirements.
We encourage you to extend this example, share your flows, or reach out to us with new ideas. BLE development doesn’t have to be hard. With BleuIO and Node-RED, it’s just a few clicks away.
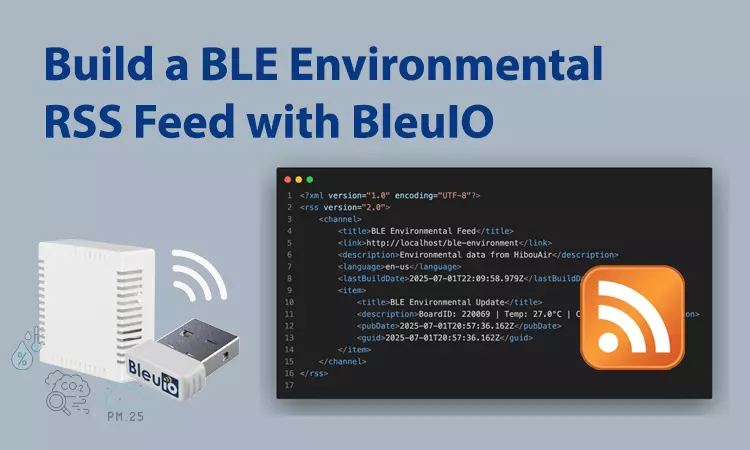
Monitoring environmental data in real time is becoming increasingly important, whether you are tracking air quality in an office, monitoring home conditions, or running a smart city project. With the BleuIO dongle and a BLE-enabled sensor like the HibouAir, it is remarkably simple to gather this data and share it with the world in a format that is open, accessible, and easy to consume.
This project demonstrates how you can turn BLE advertisement data into a live-updating RSS feed. The result is a transparent, shareable, and continuously updated stream of environmental measurements that anyone can subscribe to, whether they are using a standard RSS reader, a smart home dashboard, or an industrial system.
Project Overview
At its core, this project uses the BleuIO dongle to scan for BLE advertising packets from a HibouAir environmental sensor. The HibouAir broadcasts valuable metrics such as temperature, humidity, pressure, and CO2 levels over BLE advertisements. Instead of relying on a local desktop application or complicated server-side setups, this project leverages the power of modern browsers using the Web Serial API to connect directly to the BleuIO dongle over the USB port.
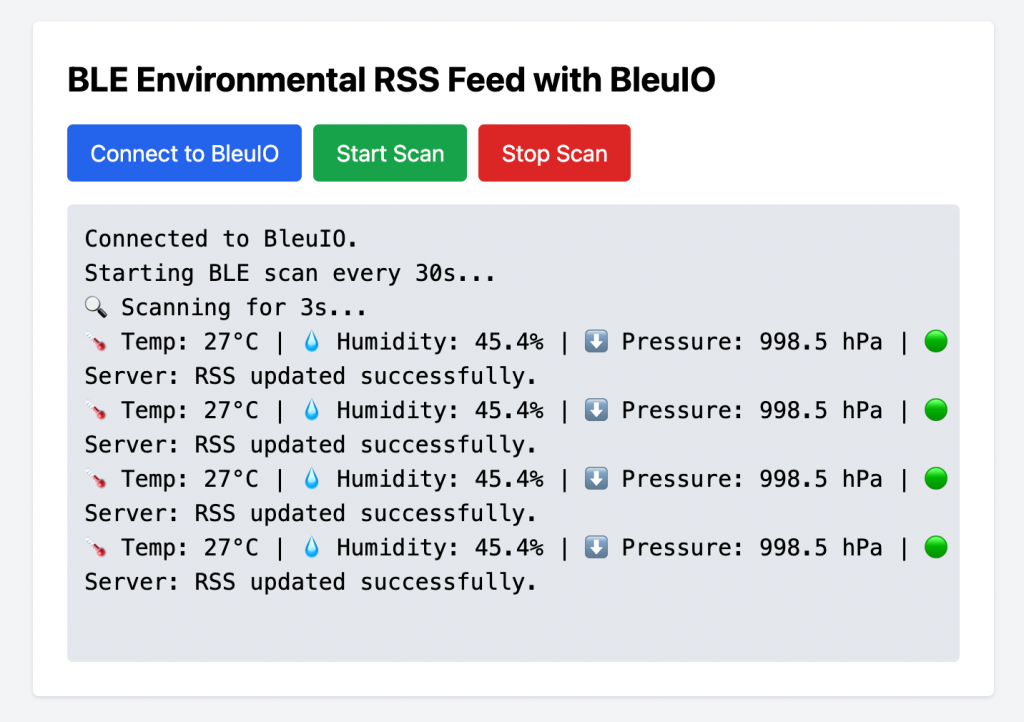
Once connected, the user can trigger BLE scans from within the browser. The scan runs every 30 seconds, decoding the broadcasted data in real time. Each new data point is sent to a lightweight PHP script on the server, which stores and appends the data in an RSS feed (rss.xml). This RSS file is immediately accessible to any subscriber or reader, allowing people to see live updates on the environmental conditions around the sensor.
The entire system is designed to be simple and easy to maintain. The frontend is styled with Tailwind CSS to ensure a responsive, polished interface. The user can connect, start scanning, stop scanning, and instantly visualize decoded data in a clear, scrollable log area.
Requirements
To build and run this project, you will need the following:
Permissions to write to rss.xml (you may need to set proper file permissions on your server)
How It Works
The project flow is straightforward. First, the user plugs the BleuIO dongle into their machine. Using the Web Serial API, the web page establishes a secure, permission-based connection with the dongle, sending standard AT commands to initiate scanning. The page decodes the advertising data using JavaScript, translating raw BLE packets into readable environmental measurements.
Every 30 seconds, a scan command is sent, retrieving the most recent advertising broadcasts. When a valid HibouAir packet is detected, the temperature, humidity, pressure, and CO2 values are extracted, timestamped, and then posted to the server using a simple JSON POST request. The PHP script running on the server receives these decoded values and appends them to the existing RSS feed. The result is a continually growing XML feed that any RSS reader can parse and display.
This approach removes the need for any heavy backend logic or traditional data pipelines. With the combination of the BLE advertisement protocol, the Web Serial API, and the simple power of RSS, the system remains robust, efficient, and fully open-standard.
Real-World Use Cases
There are many practical applications for this type of BLE-to-RSS feed system. In a smart building, it can provide real-time updates on air quality for facilities managers. Research labs can monitor and record environmental changes over time, sharing data with collaborators instantly. Homeowners could integrate the feed with smart thermostats or ventilation systems, optimizing air quality dynamically based on conditions broadcast by the HibouAir.
This approach is also perfect for educational settings, where students can learn about BLE communication, environmental sensors, and open-standard data sharing in a single, hands-on project. For communities or public-facing projects, the RSS feed provides a transparent, shareable view of conditions in a local area, encouraging citizen science or public environmental monitoring.
Why This Matters
Traditionally, BLE data collection has required local scripts, drivers, and other installation-heavy methods. Thanks to the Web Serial API, this entire solution can run in the browser, with no software to install apart from a modern web browser. The user grants permission to the serial port, connects the dongle, and can immediately start scanning, decoding, and sharing data.
By pushing this data into a simple RSS format, you gain compatibility with a huge ecosystem of readers and dashboards without reinventing the wheel. RSS is universal, easy to parse, and instantly shareable. This means a single HibouAir board and a BleuIO dongle can power an environmental feed accessible to anyone, anywhere.
Getting Started
This project is easy to set up. You only need a BleuIO dongle, a HibouAir board, a standard PHP-capable web server, and a modern web browser such as Chrome. The HTML page includes everything needed to connect to the dongle, issue scan commands, and decode results using JavaScript. Tailwind CSS ensures the user interface is polished and responsive.
After decoding, the environmental data is posted to a PHP script which appends it to an RSS feed file. From there, any visitor or RSS reader can subscribe to see the latest measurements. There is no complex backend, no cloud account, and no paid services — just a clean, standards-based solution that you can host yourself.
Source Code
The full project source code — including the HTML, JavaScript, PHP, and Tailwind-powered frontend — is available on GitHub. You can download, modify, or extend it as needed for your use case.
Feel free to clone the repository, fork it, and contribute improvements or suggestions.
Output
This project shows how BleuIO, in combination with Web Serial and simple RSS technology, can deliver an impressive, real-time environmental data feed. With minimal setup and a truly modern web-first architecture, you can build a robust, transparent, and shareable monitoring system in just a few hours.
If you are looking to explore BLE scanning, build a real-time environmental monitor, or simply share sensor data with the world in an open way, this project is a perfect starting point. Give it a try, and transform your local BLE sensors into a globally available data feed that anyone can use.