Plotting real-time graph from Bluetooth 5.0 device to Google Chrome
October 26, 2020
Hey there,
Here is a tutorial on how to plot a real-time graph of values to Google Chrome from Hibou Air Quality Monitor using BleuIO and javascript library chartjs.
For this project, I am using Bluetooth Low Energy USB dongle called BlueIO, which will act as a central device to retrieve data. Hibou Air Quality Monitor which will serve as a peripheral device to transmit the data. The script is simple to use and can be used for other purposes such as showing real-time air quality data; temperate, humidity, pressure, particle matters etc.
The data could be later stored on a cloud service of choice.
Things we need:
- Google chrome version 78 or later (windows)
- BleuIO — Bluetooth Low Energy Adapter
- Hibou Air Quality Monitor sensor device
Before we start
The article assumes you have some general knowledge of how Bluetooth Low Energy (BLE) work. Since the Chrome Serial specification on Google Chrome is not finalized yet, you will have to go to enable the highlighted flag, and restart Chrome.
open chrome://flags/#enable-experimental-web-platform-features in chrome browser.
In this example, we are going to use JavaScript + html (and some CSS for styling) to setup the BleuIO and quickly start scanning.
Step 1:
Create a file called index.html and paste the following codes. This gives you basic layout of the page with connect, scan, and get data buttons.
<!DOCTYPE html>
<html lang="en">
  <head>
    <title>Smart Sensor Devices Web Bluetooth Example</title>
    <meta charset="utf-8" />
    <meta name="ssd" content="beaconexample" />
    <meta http-equiv="X-UA-Compatible" content="IE=edge" />
    <meta name="viewport" content="width=device-width, initial-scale=1" />
    <link rel="shortcut icon" type="image/png" href="images/favicon.png" />

    <script>
      // Redirect to HTTPS if HTTP is requested.
      if (window.location.protocol === "http:") {
        window.location.href = "https:" + window.location.href.substring(5);
      }
    </script>
    <link rel="stylesheet" href="style.css" />
    <link
      rel="stylesheet"
      href="https://stackpath.bootstrapcdn.com/bootstrap/4.5.2/css/bootstrap.min.css"
      integrity="sha384-JcKb8q3iqJ61gNV9KGb8thSsNjpSL0n8PARn9HuZOnIxN0hoP+VmmDGMN5t9UJ0Z"
      crossorigin="anonymous"
    />


  </head>
  <body>
    <div class="container">
      <div
        id="carouselExampleFade"
        class="carousel slide carousel-fade"
        data-ride="carousel"
      >
        <div class="carousel-inner">
          <div class="carousel-item active">
            <div class="row">
              <div class="col-md-9 caption">
                <img src="images/logo.png" />
                <h1>Bluetooth® low energy adapter</h1>
                <a
                  class="btn btn-info btn-lg"
                  href="https://www.bleuio.com/"
                  target="_blank"
                  >Learn More</a
                >
              </div>
              <div class="col-md-3">
                <img
                  src="images/bleuIO_white_withlogo.png"
                  class="d-block w-100"
                  alt="..."
                />
              </div>
            </div>
          </div>
          <div class="carousel-item">
            <div class="row">
              <div class="col-md-9 caption">
                <img src="images/logo.png" />
                <h1>Create your own BLE applications</h1>
                <a
                  class="btn btn-info btn-lg"
                  href="https://www.bleuio.com/"
                  target="_blank"
                  >Learn More</a
                >
              </div>
              <div class="col-md-3">
                <img
                  src="images/bleuIO_black_withlogo.png"
                  class="d-block w-100"
                  alt="..."
                />
              </div>
            </div>
          </div>
          <div class="carousel-item">
            <div class="row">
              <div class="col-md-9 caption">
                <img src="images/logo.png" />
                <h1>Quick, Innovative, Simple</h1>
                <a
                  class="btn btn-info btn-lg"
                  href="https://www.bleuio.com/"
                  target="_blank"
                  >Learn More</a
                >
              </div>
              <div class="col-md-3">
                <img
                  src="images/bleuIO_black_withlogo.png"
                  class="d-block w-100"
                  alt="..."
                />
              </div>
            </div>
          </div>
        </div>
      </div>
      <!-- end carousel -->
    </div>
    <!-- end container -->
    <div class="codesection">
      <div class="container">
        <h1>Web Sensor Plotter Example</h1>
        <main class="main">
          <div id="notSupported" class="hidden alert alert-danger">
            Sorry, <b>Web Serial</b> is not supported on this device, make sure
            you're running Chrome 78 or later and have enabled the
            <code>#enable-experimental-web-platform-features</code> flag in
            <code>chrome://flags</code> <br />
            Open
            <strong>
              chrome://flags/#enable-experimental-web-platform-features</strong
            >
            in Google Chrome browser.
          </div>

          <br />
          <button id="butConnect" type="button" class="btn btn-success">
            Connect
          </button>
          <br /><br />
          <div class="row">
            <div class="col-md-3"><button id="butScan" type="button" disabled class="btn btn-primary">
              Scan BLE Devices
            </button></div>
            <div class="col-md-3">
              <select class="devices form-control" id="devices"  onchange="getSelectedDevice(this)">
                <option value="">Select a Device</option>
              </select></div>
            <div class="col-md-3"><button
              id="butGetData"
              type="button"
              disabled
              class="btn btn-primary"
            >
              Get Data
            </button></div>
          </div>


          <br /><br />


          <pre id="log" class="mt-5 d-none"></pre>

          <div style="background: white;">
            <canvas id="myChart"></canvas>
          </div>


        </main>
      </div>
    </div>
    <div class="footer text-center mt-3">
      Powered by <a href="https://www.bleuio.com/" target="_blank">BleuIO</a> .
      A product of
      <a href="http://smartsensordevices.com/" target="_blank"
        >Smart Sensor Devices</a
      >
    </div>

    <!-- end container -->
    <!-- JS, Popper.js, and jQuery -->
    <script
      src="https://code.jquery.com/jquery-3.5.1.slim.min.js"
      integrity="sha384-DfXdz2htPH0lsSSs5nCTpuj/zy4C+OGpamoFVy38MVBnE+IbbVYUew+OrCXaRkfj"
      crossorigin="anonymous"
    ></script>
    <script
      src="https://cdn.jsdelivr.net/npm/popper.js@1.16.1/dist/umd/popper.min.js"
      integrity="sha384-9/reFTGAW83EW2RDu2S0VKaIzap3H66lZH81PoYlFhbGU+6BZp6G7niu735Sk7lN"
      crossorigin="anonymous"
    ></script>
    <script
      src="https://stackpath.bootstrapcdn.com/bootstrap/4.5.2/js/bootstrap.min.js"
      integrity="sha384-B4gt1jrGC7Jh4AgTPSdUtOBvfO8shuf57BaghqFfPlYxofvL8/KUEfYiJOMMV+rV"
      crossorigin="anonymous"
    ></script>
    <script src="script.js" defer></script>

    <script src="https://cdn.jsdelivr.net/npm/moment@2.24.0/min/moment.min.js"></script>
  <script src="https://cdn.jsdelivr.net/npm/chart.js@2.8.0"></script>
  <script src="https://cdn.jsdelivr.net/npm/hammerjs@2.0.8"></script>
<script src="https://cdn.jsdelivr.net/npm/chartjs-plugin-zoom@0.7.7"></script>
	<script src="https://cdn.jsdelivr.net/npm/chartjs-plugin-streaming@1.8.0"></script>

  </body>
</html>
Step 2:
Create a file called script.js and paste the following codes.
"use strict";

let port;
let reader;
let inputDone;
let outputDone;
let inputStream;
let outputStream;
let isScanning = false;
let isGettingData = false;
let hibouDevices = [];
let rightDevice = false;
let scannedSensorData = []
var chartColors = {
	red: 'rgb(255, 99, 132)',
	orange: 'rgb(255, 159, 64)',
	yellow: 'rgb(255, 205, 86)',
	green: 'rgb(75, 192, 192)',
	blue: 'rgb(54, 162, 235)',
	purple: 'rgb(153, 102, 255)',
	grey: 'rgb(96, 125, 139)'
};
var color = Chart.helpers.color;
const log = document.getElementById("log");
const butConnect = document.getElementById("butConnect");
const butScan = document.getElementById("butScan");
const butGetData = document.getElementById("butGetData");

document.addEventListener("DOMContentLoaded", () => {
  butScan.addEventListener("click", clickScan);
  butGetData.addEventListener("click", clickGetData);
  butConnect.addEventListener("click", clickConnect);
  const notSupported = document.getElementById("notSupported");
  notSupported.classList.toggle("hidden", "serial" in navigator);
});
function randomScalingFactor() {
	return (Math.random() > 0.5 ? 1.0 : -1.0) * Math.round(Math.random() * 100);
}
function onRefresh(chart) {
    chart.config.data.datasets[0].data.push({
			x: Date.now(),
			y: scannedSensorData.p
        });
    chart.config.data.datasets[1].data.push({
			x: Date.now(),
			y: scannedSensorData.t
        });
        chart.config.data.datasets[2].data.push({
			x: Date.now(),
			y: scannedSensorData.als
        });
        chart.config.data.datasets[3].data.push({
          x: Date.now(),
          y: scannedSensorData.voc
            });
        chart.config.data.datasets[4].data.push({
          x: Date.now(),
          y: scannedSensorData.h
            });
            chart.config.data.datasets[5].data.push({
              x: Date.now(),
              y: scannedSensorData.pm25
                });
}
var config = {
	type: 'line',
	data: {
		datasets: [ {
			label: 'Pressure',
			backgroundColor: color(chartColors.red).alpha(0.5).rgbString(),
			borderColor: chartColors.red,
			fill: false,
			cubicInterpolationMode: 'monotone',
			data: []
        },
        {
			label: 'Temperature',
			backgroundColor: color(chartColors.blue).alpha(0.5).rgbString(),
			borderColor: chartColors.blue,
			fill: false,
			cubicInterpolationMode: 'monotone',
			data: []
		},
        {
			label: 'Light',
			backgroundColor: color(chartColors.orange).alpha(0.5).rgbString(),
			borderColor: chartColors.orange,
			fill: false,
			cubicInterpolationMode: 'monotone',
			data: []
    },
    {
			label: 'VOC',
			backgroundColor: color(chartColors.grey).alpha(0.5).rgbString(),
			borderColor: chartColors.grey,
			fill: false,
			cubicInterpolationMode: 'monotone',
			data: []
		},
    {
  label: 'Humidity',
  backgroundColor: color(chartColors.green).alpha(0.5).rgbString(),
  borderColor: chartColors.green,
  fill: false,
  cubicInterpolationMode: 'monotone',
  data: []
},
{
label: 'PM 2.5',
backgroundColor: color(chartColors.purple).alpha(0.5).rgbString(),
borderColor: chartColors.purple,
fill: false,
cubicInterpolationMode: 'monotone',
data: []
}]
	},
	options: {
		title: {
			display: true,
			text: 'Hibou - Realtime data'
    },

		scales: {
			xAxes: [{
				type: 'realtime',
				realtime: {
					duration: 20000,
					refresh: 2000,
          delay: 2000,
          ttl:1000000,
					onRefresh: onRefresh
        },
        gridLines: {
          display:false
      }
			}],
			yAxes: [{
				scaleLabel: {
					display: true,
					labelString: 'value'
        }
			}]
    },
    plugins: {
      zoom: {
            // Container for zoom options
          zoom: {
              // Boolean to enable zooming
              enabled: true,

              // Zooming directions. Remove the appropriate direction to disable
              // Eg. 'y' would only allow zooming in the y direction
              mode: 'x',
          }
      }
  },
		tooltips: {
			mode: 'nearest',
			intersect: false
		},
		hover: {
			mode: 'nearest',
			intersect: false
		}
	}
};
var colorNames = Object.keys(chartColors);

/**
 * @name connect
 * Opens a Web Serial connection to a serial device such as a Smart USB Dongle 2.0 and sets up the input and
 * output stream.
 */
async function connect() {
  // - Request a port and open a connection.
  port = await navigator.serial.requestPort();
  // - Wait for the port to open.
  await port.open({ baudRate: 9600 });

  const encoder = new TextEncoderStream();
  outputDone = encoder.readable.pipeTo(port.writable);
  outputStream = encoder.writable;

  let decoder = new TextDecoderStream();
  inputDone = port.readable.pipeTo(decoder.writable);
  inputStream = decoder.readable.pipeThrough(
    new TransformStream(new LineBreakTransformer())
  );

  reader = inputStream.getReader();
  readLoop().catch((error) => {
    toggleUIConnected(false);
    port = null;
    log.textContent = "Dongle Disconnected!";
  });
}

/**
 * @name disconnect
 * Closes the Web Serial connection.
 */
async function disconnect() {
  // Close the input stream (reader).
  if (reader) {
    await reader.cancel();
    await inputDone.catch(() => {});
    reader = null;
    inputDone = null;
  }
  // Close the output stream.
  if (outputStream) {
    await outputStream.getWriter().close();
    await outputDone;
    outputStream = null;
    outputDone = null;
  }
  // Close the port.
  await port.close();
  port = null;
  log.textContent = "Dongle Disconnected!";
}

/**
 * @name clickConnect
 * Click handler for the connect/disconnect button.
 * Checks if port != null
 * If true: Checks if any beacons is advertising or scans are running and stops the advertsing or scan if so. Then runs disconnect() and set toggleUIConnected to false.
 * if false: Runs connect() then set toggleUIConnected to true.
 */
async function clickConnect() {
  log.textContent = "";
  if (port) {

    // If disconnected while scanning the dongle will restart
    if (isScanning) {
      writeCmd("\x03");
      butScan.textContent = "Scan BLE Devices";
      isScanning = false;
    }
    await disconnect();
    toggleUIConnected(false);
    return;
  }
  await connect();
  toggleUIConnected(true);
}

function getSelectedDevice(selectObject) {
  var selectedDevice = selectObject.value;
  localStorage.setItem("selectedDevice", selectedDevice);
}

/**
 * @name clickScan
 * Click handler for the Scan button.
 * Checks if a scan is already running by checking the boolean isScanning.
 * If isScanning = true: Stops scanning and goes back to peripheral mode, changes the button text and shows the beacon buttons. Finally sets isScanning = false.
 * If isScanning = false: Goes into Central mode and starts scanning for ble devices. Also changes button text and hides the beacon buttons. Finally sets isScanning = true.
 */
function clickScan() {
  console.log("SCAN BUTTON PRESSED");
  if (isScanning) {
    writeCmd("\x03"); // Ctrl+C to stop the scan
    setTimeout(() => {
      writeCmd("AT+PERIPHERAL"); // Set the dongle in Peripheral mode needed for advertising.
    }, 500); // Waiting half a bit to make sure each command will get through separately.
    isScanning = false;
    butGetData.removeAttribute("disabled");
    butScan.textContent = "Scan BLE Devices";

    return;
  }
  hibouDevices = [];
  writeCmd("AT+CENTRAL"); // Set the dongle in Central mode needed for scanning.
  setTimeout(() => {
    writeCmd("AT+GAPSCAN=3");
  }, 500); // Waiting half a bit to make sure each command will get through separately.

  butScan.textContent = "Stop Scanning...";
  butGetData.setAttribute("disabled", "true");
  log.classList.toggle("d-none", false);

  isScanning = true;
}

/**
 * @name clickGetData
 * Click handler for the 'Get Data' button.
 * Checks if a getData scan is already running by checking the boolean isGettingData.
 * If isGettingData = true: Stops scanning and goes back to peripheral mode, changes the button text and shows the scan button. Finally sets isGettingData = false.
 * If isGettingData = false: Goes into Central mode and starts scanning for ble devices data. Also changes button text and hides the scan button. Finally sets isGettingData = true.
 */
function clickGetData() {
  console.log("GET DATA BUTTON PRESSED");
  if (isGettingData) {
    writeCmd("\x03"); // Ctrl+C to stop the scan
    setTimeout(() => {
      writeCmd("AT+PERIPHERAL"); // Set the dongle in Peripheral mode needed for advertising.
    }, 500); // Waiting half a bit to make sure each command will get through separately.
    isGettingData = false;
    if(window.myChart){
      window.myChart.destroy();
    }
    butScan.removeAttribute("disabled");
    butGetData.textContent = "Get Data";
    return;
  }
  writeCmd("AT+CENTRAL"); // Set the dongle in Central mode needed for scanning.
  setTimeout(() => {
   writeCmd("AT+FINDSCANDATA=FF5B07"); // Will just scan for adv data that contains 'FF5B07' which is the tag for Manufaturing Specific Data (FF) and our Company ID (5B07).
  }, 500); // Waiting half a bit to make sure each command will get through separately.

  butGetData.textContent = "Stop Getting Data...";
  butScan.setAttribute("disabled", "true");
  log.classList.toggle("d-none", false);

  isGettingData = true;
    var ctx = document.getElementById('myChart').getContext('2d');
  window.myChart = new Chart(ctx, config);

}

/**
 * @name readLoop
 * Reads data from the input stream and displays it on screen.
 */
async function readLoop() {
  while (true) {
    const { value, done } = await reader.read();
    if (value && (!isScanning && !isGettingData)) {
      log.textContent += value + "\n";
    }
    if (value && isScanning) {
      if(value === "SCAN COMPLETE") {
        isScanning = false;
        butScan.textContent = "Scan BLE Devices";
        log.textContent += "\n" +"Scan Done" + "\n";
        butGetData.removeAttribute("disabled");
        log.classList.toggle("d-none", false);
      }
      let lineValueArray = value.split(" ");
      if (lineValueArray[6] === "(HibouAIR)") {
        if(lineValueArray[2]) {
          hibouDevices.push("["+lineValueArray[2].replace("[1]", "") +"]");

        }
        log.textContent = "\n" + "hibouDevices found: " + hibouDevices.length + "\n";
      }
      if(value === "SCAN COMPLETE") {
        var select = document.getElementById("devices");
        hibouDevices.map(function(item){
          var option = document.createElement("option");
          option.value = item;
          option.text  = item;
          select.appendChild(option)
        });
      }

    }
    if (value && isGettingData) {
      if(value === "SCAN COMPLETE") {
        isGettingData = false;
        butGetData.textContent = "Get Data";
        log.textContent += "\n" +"Scan Done" + "\n";
        butScan.removeAttribute("disabled");
        log.classList.toggle("d-none", false);
      }

      let lineValueArray = value.split(" ");
      if(!rightDevice) { // The advdata is spread on two lines, the first identifies it,
        if (lineValueArray[0] ===   localStorage.getItem("selectedDevice") && lineValueArray[3] === "[ADV]:") {
          rightDevice = true;
          //console.log("CONSOLE.LOG= "+value);
        }
      } else if (rightDevice) { // Second line contains the actual advdata string we need to parse
        scannedSensorData = parseSensorData(lineValueArray[1]);
        log.textContent = "\n" + "SensorData= " + JSON.stringify(scannedSensorData) + "\n";
//console.log(scannedSensorData.p)
        //console.log("CONSOLE.LOG= "+value);
        rightDevice = false;
      }

    }
    if (done) {
      console.log("[readLoop] DONE", done);
      reader.releaseLock();
      break;
    }
  }
}
/**
 * @name writeCmd
 * Gets a writer from the output stream and send the command to the Smart USB Dongle 2.0.
 * @param  {string} cmd command to send to the Smart USB Dongle 2.0
 */
function writeCmd(cmd) {
  // Write to output stream
  const writer = outputStream.getWriter();
  console.log("[SEND]", cmd);

  writer.write(cmd);
  // Ignores sending carriage return if sending Ctrl+C
  if (cmd !== "\x03") {
    writer.write("\r"); // Important to send a carriage return after a command
  }
  writer.releaseLock();
}

/**
 * @name LineBreakTransformer
 * TransformStream to parse the stream into lines.
 */
class LineBreakTransformer {
  constructor() {
    // A container for holding stream data until a new line.
    this.container = "";
  }

  transform(chunk, controller) {
    // Handle incoming chunk
    this.container += chunk;
    const lines = this.container.split("\r\n");
    this.container = lines.pop();
    lines.forEach((line) => controller.enqueue(line));
  }

  flush(controller) {
    // Flush the stream.
    controller.enqueue(this.container);
  }
}

/**
 * @name toggleUIConnected
 * Changes the text on butConnect depending on the action it actually will preform in the current state.
 * @param  {boolean} connected true if connected, false if disconnected.
 */
function toggleUIConnected(connected) {
  let lbl = "Connect";
  if (connected) {
    lbl = "Disconnect";
    butGetData.removeAttribute("disabled");
    butScan.removeAttribute("disabled");
  }
  butScan.classList.toggle("disabled", !connected);
  butGetData.classList.toggle("disabled", !connected);
  butConnect.textContent = lbl;
}

/**
 * @name parseSensorData
 * Parse the data from advertising data string.
 * @param  {string} input advertising data string.
 * @returns {object ={sensorid:{string}, p:{int}, t:{int}, h:{int}, als:{int}, pm1:{int}, pm25:{int}, pm10:{int}}}
 */
function parseSensorData(input) {
  let counter = 13;
  if (input.includes("5B070503")) {
    counter = 17;
  }
  let sensorData = {
    sensorid:
      input[counter + 1] +
      input[counter + 2] +
      input[counter + 3] +
      input[counter + 4] +
      input[counter + 5] +
      input[counter + 6],
    p:
      parseInt(
        input[counter + 13] +
          input[counter + 14] +
          input[counter + 11] +
          input[counter + 12],
        16
      ) / 10,
    t:
      parseInt(
        input[counter + 17] +
          input[counter + 18] +
          input[counter + 15] +
          input[counter + 16],
        16
      ) / 10,
    h:
      parseInt(
        input[counter + 21] +
          input[counter + 22] +
          input[counter + 19] +
          input[counter + 20],
        16
      ) / 10,
      voc:
      parseInt(
        input[counter + 25] +
          input[counter + 26] +
          input[counter + 23] +
          input[counter + 24],
        16
      ) / 10,
    als: parseInt(
      input[counter + 9] +
        input[counter + 10] +
        input[counter + 7] +
        input[counter + 8],
      16
    ),
    pm1:
      parseInt(
        input[counter + 29] +
          input[counter + 30] +
          input[counter + 27] +
          input[counter + 28],
        16
      ) / 10,
    pm25:
      parseInt(
        input[counter + 33] +
          input[counter + 34] +
          input[counter + 31] +
          input[counter + 32],
        16
      ) / 10,
    pm10:
      parseInt(
        input[counter + 37] +
          input[counter + 38] +
          input[counter + 35] +
          input[counter + 36],
        16
      ) / 10}
  return sensorData
}
// readLoop()
//   .then((data) => { console.log(data)})
window.onload = function() {
	//var ctx = document.getElementById('myChart').getContext('2d');
	//window.myChart = new Chart(ctx, config);
};
This js has all the codes and uses Chrome Serial to
· Connect to your BleuIO Bluetooth dongle,
· Scan nearby devices using the AT-commands
· Receive and store the data
· Generate real time charts from the data.
All the functions used in the script are well commented for understanding.
Step 3:
Now create a style.css on the root folder and paste the following codes. They will give your site a clean look.
.hidden {
  display: none !important;
}

.mb-button {
  align-self: center;
  background-color: #666;
  border-radius: 100%;
  box-shadow: 0 4px 5px 0 rgba(0, 0, 0, 0.14), 0 2px 9px 1px rgba(0, 0, 0, 0.12),
    0 4px 2px -2px rgba(0, 0, 0, 0.2);
  height: 30px;
  width: 30px;
}

.pressed {
  background-color: #d81b60;
  box-shadow: inset 0px 0px 5px #c1c1c1;
  outline: none;
}
.caption {
  margin-top: 100px;
}
pre {
  padding: 20px;
  color: #ffffff !important;
  background-color: #222;
  white-space: pre;
  text-shadow: 0 1px 0 #000;
  border-radius: 5px;
  border-bottom: 1px solid #555;
  box-shadow: 0 1px 5px rgba(0, 0, 0, 0.4) inset,
    0 0 20px rgba(0, 0, 0, 0.2) inset;
  font: 16px/24px "Courier New", Courier, "Lucida Sans Typewriter",
    "Lucida Typewriter", monospace;
}
.codesection {
  background: #0d4c8d;
  color: white;
  padding: 20px 0;
  min-height: 500px;
}
You can download the complete script from here.https://github.com/smart-sensor-devices-ab/Web-Hibou-Sensor-Plotter.git
Step 4:
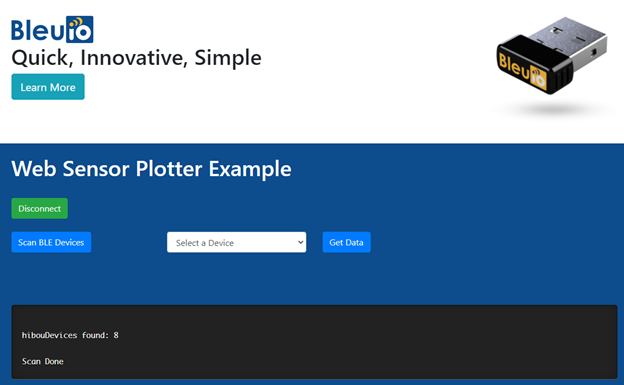
Once you have everything ready, open the index.html file. Your page should look like this

Now connect your BleuIO device to your computer and click connect. Wait for your device to show up on the port screen.
Select your device and press connect.

Once the device is connected, you can scan for nearby devices. For this project I have added a filter so that it will only look for Hibou BLE devices. You will see a list of devices on the dropdown menu. We have a small console on the page that shows scan status and number of devices found. Now you can select a device from the dropdown and start getting data from the device.
Once you click on get data after selecting a device, it will start to generate graphs using chartjs using real-time data from Hibou Air Quality Monitor.
In my script I am showing Pressure, Temperature, ALS, VOC, Humidity, PM2.5
You can customize your own chart by updating values. All the codes for charts are available on script.js
Done
Here is our real time chart showing on web browser.

Follow this video if you find any difficulties.