Log Real-Time BLE Air Quality Data from HibouAir to Google Sheets using BleuIO
October 10, 2025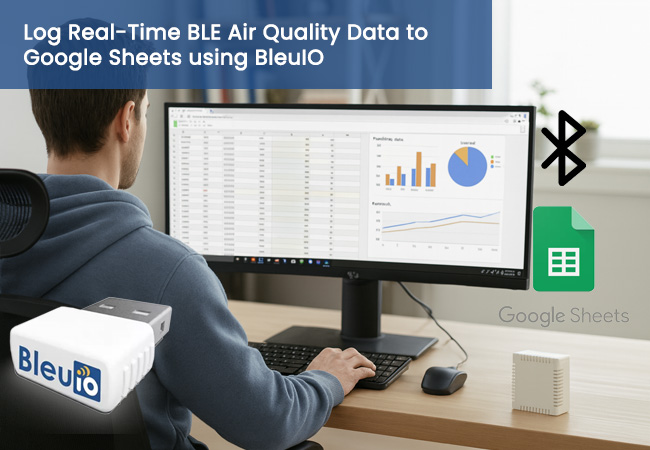
Have you ever wanted to stream real-time air quality data from a Bluetooth sensor straight into the cloud — without any expensive gateway or IoT server?
In this tutorial, we’ll show you how to use the BleuIO USB dongle and a HibouAir sensor to capture CO2, temperature, and humidity readings over Bluetooth Low Energy (BLE), then automatically log them into Google Sheets for easy tracking and visualization.
By the end, you’ll have a live data logger that updates your Google Sheet every few seconds with real environmental readings — and you’ll even learn how to create charts directly inside Google Sheets.
What is Google Sheets?
Google Sheets is a free, cloud-based spreadsheet application that lets you create, edit, and share data online in real time. It’s part of Google’s Workspace tools and is accessible from any device with an internet connection. Because it stores data in the cloud, it’s ideal for data logging, quick testing, and lightweight analysis — especially for IoT projects. You can capture sensor readings, visualize trends with charts, and even connect Sheets to other platforms like Google Looker Studio or BigQuery for deeper analytics. For developers and makers, Google Sheets serves as an excellent starting point for collecting and analyzing data without needing a dedicated server or database.
What You’ll Need
- A BleuIO USB dongle
- A HibouAir CO2 sensor
- A Google account (for Sheets and Apps Script)
You’ll also need a few Python libraries, which we’ll install below.
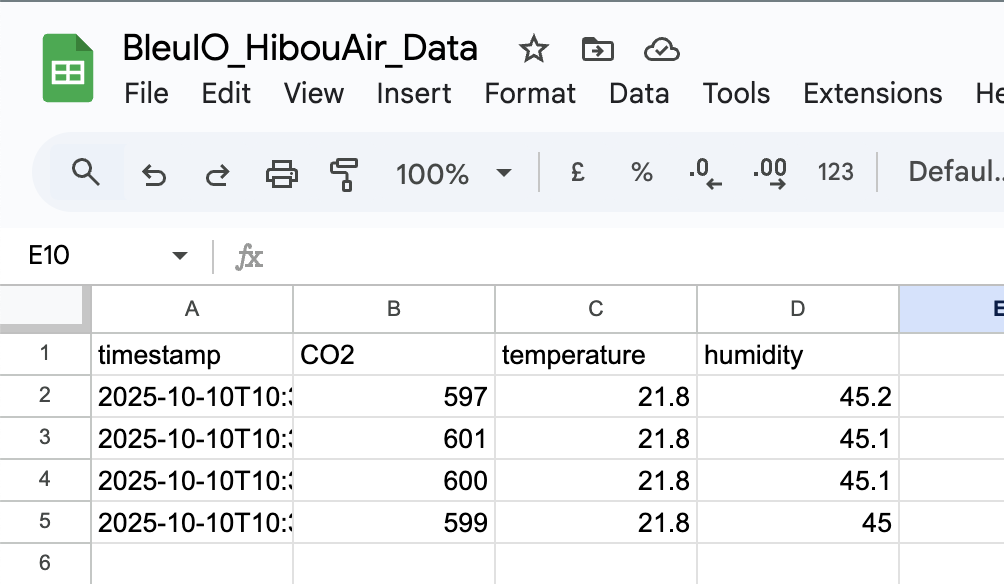
Step 1 — Set Up Your Google Sheet
We’ll use Google Sheets as our cloud storage for the data.
- Go to Google Sheets and create a new spreadsheet.
- Name it something like
BleuIO_HibouAir_Data. - Rename the first tab to
data. - In the first row, add the following headers:
timestamp, CO2, temperature, humidity
Step 2 — Create a Google Apps Script Webhook
Next, we’ll build a small Google Apps Script that accepts POST requests and appends data to your sheet.
- Open https://script.google.com/home and click New Project.
- Paste this code into the editor:
// ===== CONFIG =====
const SPREADSHEET_ID = 'YOUR_SHEET_ID_HERE'; // from your sheet URL
const SHEET_NAME = 'data'; // tab name
// ==================

function doPost(e) {
  const sheet = SpreadsheetApp.openById(SPREADSHEET_ID).getSheetByName(SHEET_NAME);
  if (!e || !e.postData || !e.postData.contents) {
    return ContentService.createTextOutput('NO_BODY');
  }
  let payload = JSON.parse(e.postData.contents);
  const rows = Array.isArray(payload) ? payload : [payload];
  const toRow = o => [
    o.timestamp || new Date().toISOString(),
    Number(o.CO2),
    Number(o.temperature),
    Number(o.humidity)
  ];
  const values = rows.map(toRow);
  sheet.getRange(sheet.getLastRow() + 1, 1, values.length, values[0].length).setValues(values);
  return ContentService.createTextOutput('OK');
}
- Replace
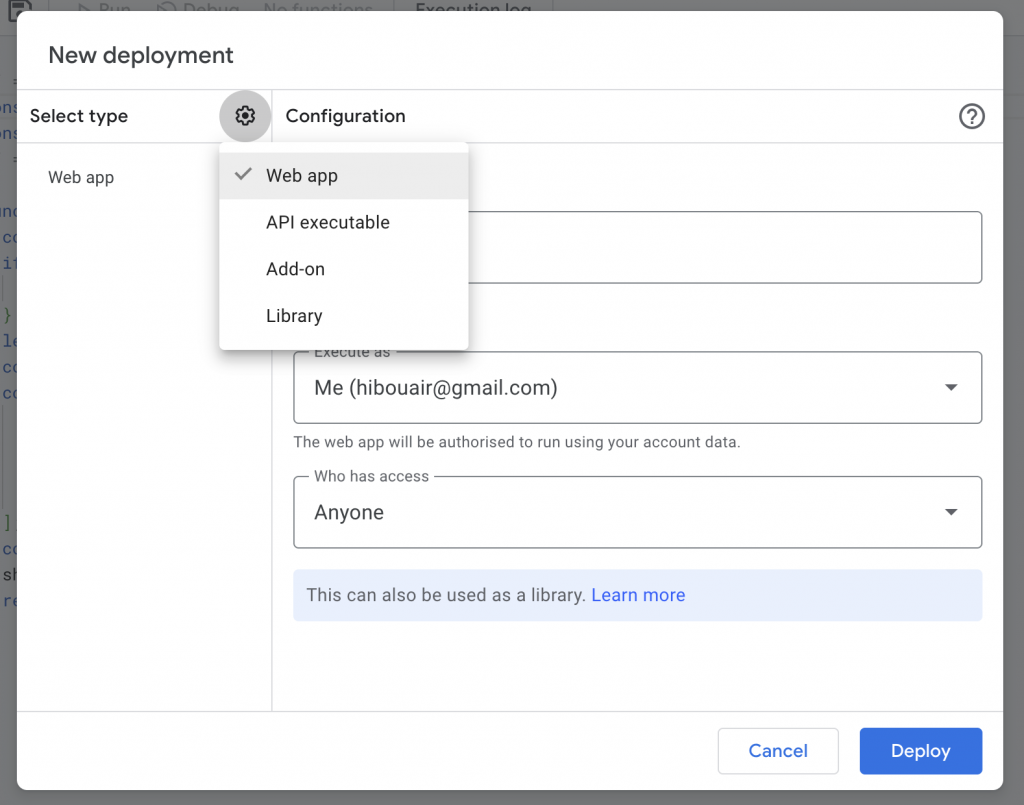
YOUR_SHEET_ID_HEREwith your sheet’s ID — it’s the long string between/d/and/editin your Sheet URL. - Click Deploy → New Deployment → choose Web app.
- Under settings:
- Execute as: Me
- Who has access: Anyone with the link
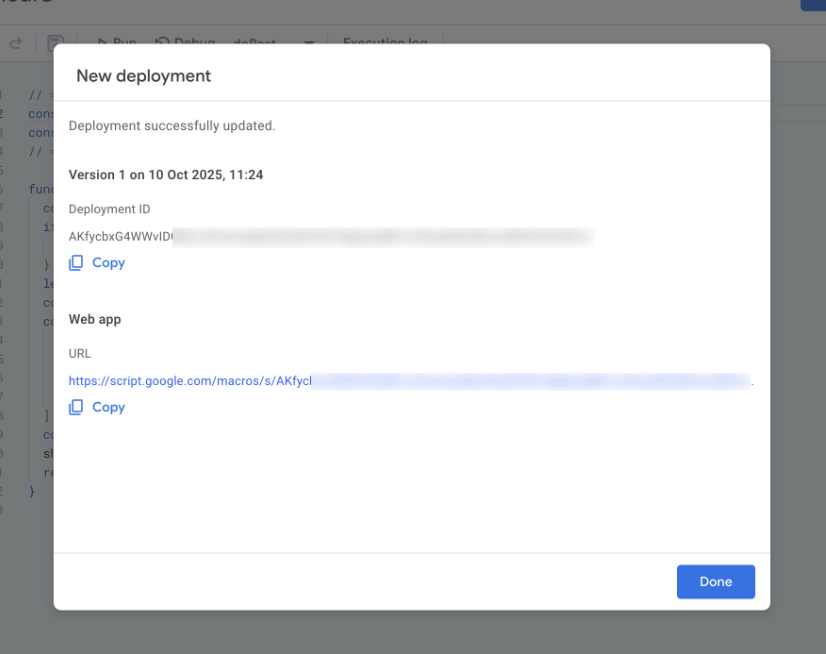
- Click Deploy, then copy the Web app URL.
This will be yourWEBHOOK_URL.
Step 3 — Install Python Libraries
Open your terminal (or PowerShell) and install the required dependencies:
pip install pyserial requests
These will let Python talk to the BleuIO dongle and send HTTPS requests to Google Sheets.
Step 4 — Connect and Configure the BleuIO Dongle
Plug in your BleuIO USB dongle.
- On macOS, it will appear as something like
/dev/cu.usbmodemXXXX. - On Windows, it will show up as
COMX.
You can list serial ports to confirm:
ls /dev/cu.usbmodem* # macOS
or
Get-WMIObject Win32_SerialPort | Select-Object DeviceID,Name # Windows
Step 5 — Run the Python Script
Now we’ll use a Python script that handles the entire process automatically. The script first connects to the BleuIO dongle and sets it to central mode using the AT+CENTRAL command, which allows it to scan for nearby BLE devices. It then searches for HibouAir BLE advertisements using the AT+FINDSCANDATA=220069=3 command, which filters packets matching the HibouAir sensor’s unique identifier. Once it receives a valid advertisement, the script decodes the CO2, temperature, and humidity values from the data packet. Finally, it packages these readings along with a timestamp and pushes them to your Google Apps Script webhook, which automatically logs them into your Google Sheet.
📂 GitHub Repository: View Source Code on GitHub
Before running, update:
SERIAL_PORT→ your BleuIO portWEBHOOK_URL→ your Google Apps Script Web App URL
Step 6 — Watch Your Data Flow!
Open your Google Sheet. You’ll see new rows appear every few seconds:
| timestamp | CO2 | temperature | humidity |
|---|---|---|---|
| 2025-10-10T14:48:07.849Z | 514 | 23.8 | 46.1 |
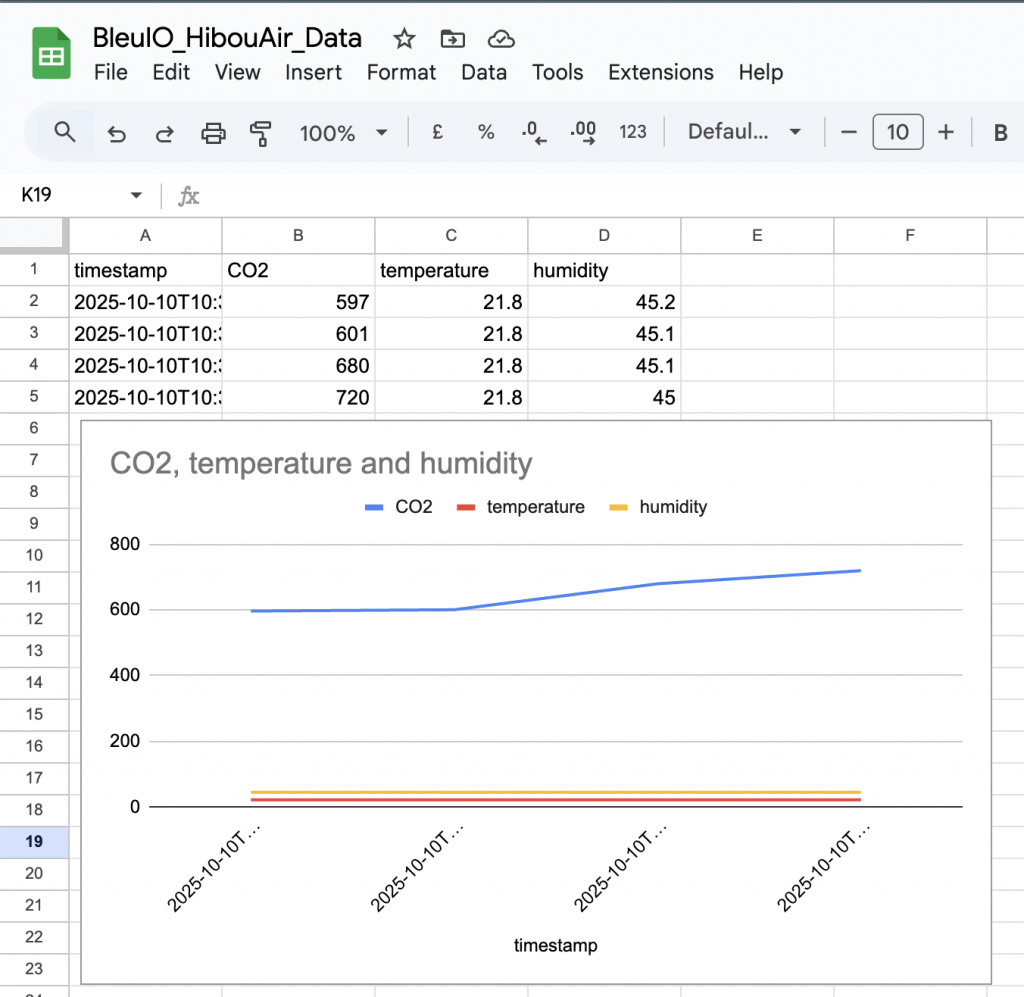
Step 7 — Create Charts in Google Sheets
Once your data is flowing into Google Sheets, you can easily visualize it without using any external tools. Start by highlighting the range of data you want to analyze, then go to Insert → Chart in the menu. Google Sheets will automatically suggest a chart type, but you can switch to a Line Chart or Combo Chart to better visualize trends over time. For a more dashboard-like view, you can also add a Gauge Chart to display real-time values for CO₂ or temperature. Customize the chart’s colors, titles, and formatting to match your preferences, and adjust refresh settings so your visuals update automatically as new data arrives.
And that’s it! You’ve built a real-time BLE air-quality logger with BleuIO and Google Sheets — no servers, no databases, no fuss.
This setup is perfect for classrooms, offices, or research labs that need quick, visual environmental monitoring.
Use Cases
This project demonstrates how you can use BleuIO and Google Sheets to quickly prototype and test IoT ideas. For example, it’s perfect for indoor air-quality monitoring in offices, classrooms, or labs, allowing you to observe changes in CO₂ levels, temperature, and humidity over time. Researchers can use it to log environmental data during experiments or field studies. It’s also useful for IoT developers who want to validate BLE sensors or test new device firmware without setting up a backend system. Teachers can turn this setup into an educational project, helping students understand Bluetooth communication, data logging, and visualization. Overall, pairing BleuIO with Google Sheets offers a fast, free, and flexible way to monitor and analyze real-world sensor data.
Whether you’re analyzing indoor air quality, tracking sensor performance, or just exploring IoT data pipelines, BleuIO makes BLE integration simple and powerful.