Building a BLE-Powered Air Quality Dashboard with Grafana
July 18, 2025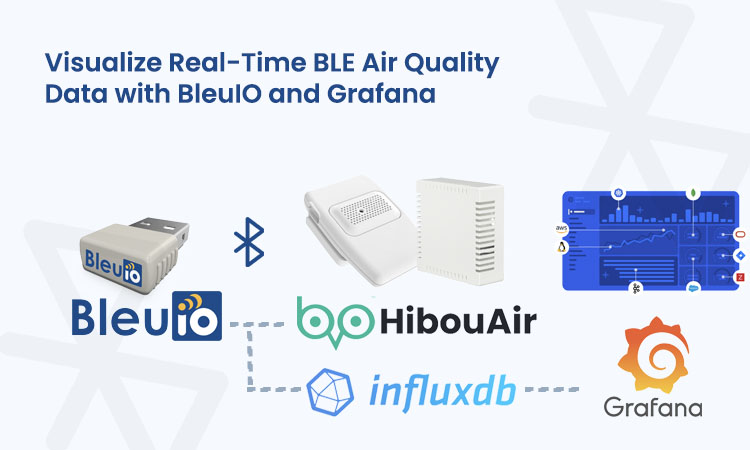
Indoor air quality is an important factor in workplace health, home comfort, and industrial safety. Monitoring CO2, particulate matter, temperature, humidity, and other environmental metrics can help prevent health issues, optimize HVAC usage, and maintain compliance with building standards. In this tutorial, we’ll walk through building a complete air quality monitoring solution using the BleuIO USB dongle and the HibouAir BLE sensor. We’ll use Python to collect data, InfluxDB to store it, and Grafana to visualize it in real time.
This project works entirely offline, runs on both macOS and Windows, and is suitable for personal, educational, or professional use. Whether you want to monitor a home office or manage sensors in an industrial setup, this system is simple to deploy and easy to scale.
What You Need
You will need one BleuIO USB dongle and one HibouAir BLE sensor. These two devices form the core of the setup. The BleuIO dongle will connect via a serial port and act as a BLE Central, continuously scanning for BLE advertisement packets sent by the HibouAir sensor.
For software, you’ll need Python 3, InfluxDB, and Grafana, all of which are available for both macOS and Windows. You’ll also install a few Python packages (pyserial and influxdb) to allow your script to read data over the serial port and write it to the database.
About Grafana
Grafana is an open-source analytics and visualization platform designed to display time-series data. It integrates seamlessly with databases like InfluxDB, allowing users to create interactive and customizable dashboards. In this project, Grafana serves as the front end for visualizing live air quality data coming from the HibouAir sensor. Its intuitive interface and support for powerful queries make it ideal for monitoring environmental conditions over time, setting alerts, and gaining actionable insights from BLE sensor data.
macOS Installation
On macOS, it’s easiest to install tools using Homebrew. You can install everything with the following commands:
brew install influxdb@1
brew install grafana
brew install python
Start the services:
brew services start influxdb@1
brew services start grafana
Windows Installation
For Windows, download installers from official sites:
Make sure Python and pip are added to your system path. You can then install Python packages via:
pip install pyserial influxdb
Also, identify your BleuIO COM port by opening Device Manager and checking Ports (COM & LPT). You’ll see something like COM3, which you’ll use in the Python script.
Setting Up InfluxDB
After installing InfluxDB, you need to create a database that will store sensor readings. On macOS, open your terminal. On Windows, use Command Prompt or PowerShell.
To enter the InfluxDB CLI:
influx
Inside the CLI, run:
> CREATE DATABASE hibouair
> SHOW DATABASES
> EXIT
This creates a database called hibouair, which your Python script will use to log environmental data.
You don’t need to set up authentication for local testing. If you do secure your instance later, remember to update Grafana and the Python script with your username and password.
Configuring Grafana
Once Grafana is installed and running, open your browser and go to:
http://localhost:3000
The default username and password are:
Username: admin
Password: admin
After logging in, you’ll be asked to set a new password. Once you’re in the Grafana dashboard:
- Go to Settings → Data Sources
- Click Add data source
- Choose InfluxDB
- Set the following:
- URL:
http://localhost:8086 - Database:
hibouair - User and Password: leave empty unless you’ve enabled authentication
- HTTP Method: GET or POST (default is fine)
- URL:
- Click Save & Test
You should see a success message confirming Grafana can read from InfluxDB.
Connecting BleuIO via Serial Port
Insert your BleuIO USB dongle.
- On macOS, find the port using:
ls /dev/cu.usbmodem*Example:/dev/cu.usbmodem4048FDEBA6D01 - On Windows, check Device Manager → Ports (COM & LPT) and find something like
COM3orCOM4.
This port will be used in your Python script to open a serial connection to the dongle.
The Python Script
The Python script initializes the BleuIO dongle in Central mode, sends a scan command (AT+FINDSCANDATA), and reads the BLE advertisement packets from the HibouAir sensor. The data, which arrives in hexadecimal format, is decoded to extract values like temperature, humidity, CO2, VOC, PM1, PM2.5, PM10, light, noise, and pressure. The script then writes this data to InfluxDB with a timestamp.
To avoid storing duplicate values, the script only logs the first valid reading per scan cycle. It waits for a configurable period (e.g., 20 seconds) before scanning again.
You can view and copy the complete Python script from the GitHub repository linked below.
GitHub: bleuio-hibouair-influx-grafana
To run the script:
python3 bleuio_to_influx.py
Make sure to replace the serial port path and board ID in the script with your actual values.
Creating a Dashboard in Grafana
With data flowing into InfluxDB, it’s time to visualize it in Grafana. Start by creating a new dashboard:
- From the left menu, go to Dashboards → New → Add new panel
- In the query editor, select your InfluxDB data source
- Enter the following query to display CO2 levels:
SELECT last("co2") FROM "air_quality" WHERE $timeFilter GROUP BY time($__interval)
This query fetches the latest CO2 readings from the air_quality measurement. You can change "co2" to "temp", "hum", "voc", "pm25" or any other field depending on what you want to display.
Grafana will automatically plot the data on a line chart. You can switch to a gauge, bar, or other visualizations from the panel settings. You can also set thresholds, value ranges, and colors to improve readability.
Repeat this process to add more panels for temperature, humidity, VOCs, PM2.5, PM10, and other values.
Once your dashboard is complete, click Apply, then Save the dashboard to reuse it later.
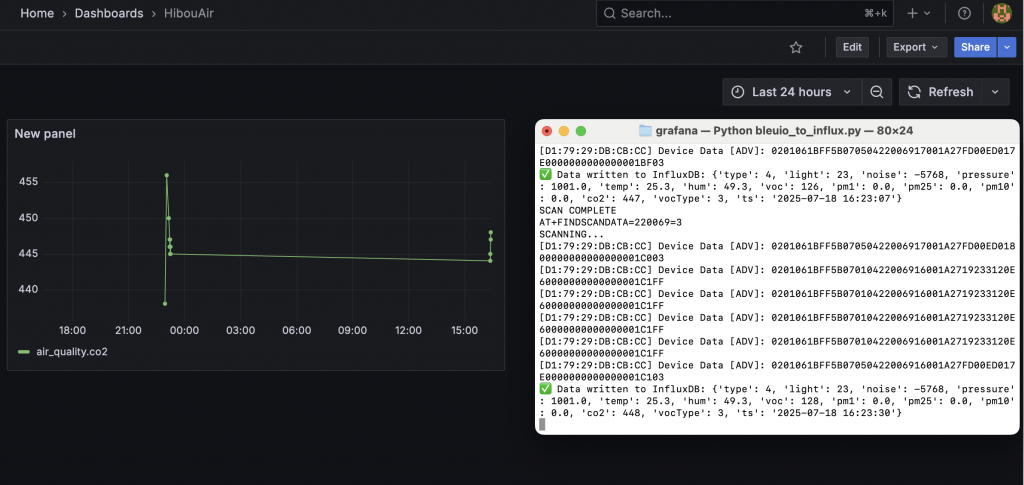
Output
How It Works
This system leverages BLE advertisement broadcasting from HibouAir and AT command-based serial communication with the BleuIO dongle. The dongle scans for a specific board ID using AT+FINDSCANDATA=<board_id>=3, and the Python script reads and decodes each advertisement received. The decoded data is immediately sent to InfluxDB using the official client library.
Grafana queries this time-series data and displays it in real time. Since all components are local, there is no dependency on external servers or cloud APIs. The system is also modular, so you can easily scale it to support multiple sensors, extend the decoder for other BLE formats, or forward data to cloud-based platforms in the future.
Use Cases
This setup is ideal for a range of applications. In an office environment, monitoring CO2 and humidity can help optimize ventilation and improve productivity. In factories or workshops, tracking particulate matter and VOCs ensures air quality compliance and safety. For researchers and students, this project provides a hands-on, local, and open-source method to study environmental changes. Even in residential settings, it can help detect poor air circulation or pollutant spikes. The simplicity of this solution makes it accessible to both developers and non-developers alike.
Extending the Project
There are several ways to expand this project:
- Add support for additional BLE data types, such as HibouAir’s
type 08advertisements for NO₂ - Set up Grafana alerts to notify you when CO2 exceeds 800 ppm or humidity drops below 30%
- Export historical data from InfluxDB to CSV for offline analysis
- Run the Python script as a background service on system boot
- Connect multiple sensors to cover multiple rooms or areas
With minimal changes, you can also run this setup on a Raspberry Pi or Linux server.
With just a BleuIO dongle, a HibouAir sensor, and a few open-source tools, you’ve built a fully functional air quality monitoring solution. The system is flexible, lightweight, and runs entirely offline. It provides real-time insights into indoor environmental conditions and can be adapted for a variety of applications.