BLE Star Topology Visualizer Using BleuIO
May 27, 2025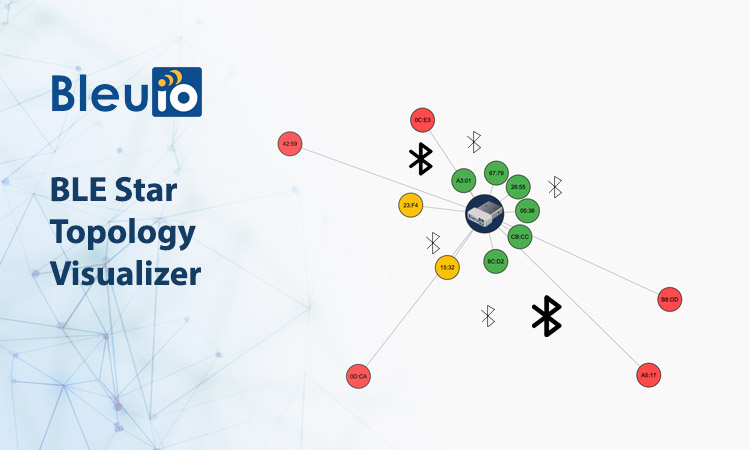
Monitoring nearby Bluetooth Low Energy (BLE) devices is essential for developers, testers, and engineers working with IoT, smart sensors, or proximity-based applications. To simplify this process, we’ve developed a visual tool—BLE Star Topology Visualizer—that connects to a BleuIO USB dongle and graphically maps nearby advertising BLE devices using RSSI-based distance estimation. This project not only provides a live BLE scan but also visualizes the proximity of devices in a central-node star topology.
What This Tool Does
The BLE Star Topology Visualizer is a web-based application that:
- Connects to a BleuIO USB dongle via Web Serial API.
- Performs a BLE GAP scan using
AT+GAPSCAN=xto detect nearby BLE devices. - Displays detected devices as nodes around the central BleuIO dongle.
- Uses RSSI (Received Signal Strength Indicator) to:
- Color-code devices (green = strong signal, red = weak signal).
- Adjust the visual distance from the center (closer = stronger signal).
- Shows device MAC address, RSSI, and name (if available) in a tooltip on hover.
Requirements
To use this BLE Star Topology Visualizer, you’ll need a BleuIO USB dongle, which acts as the central scanning device. The dongle is responsible for performing GAP scans and returning nearby Bluetooth advertising data, including RSSI values and device names. No additional drivers or installations are needed—just plug in the BleuIO dongle, open the web app in a supported browser, and you’re ready to start scanning and visualizing.
Why This is Useful
BLE developers often depend on terminal-based command outputs to monitor advertising packets from nearby devices. While functional, this raw data can quickly become difficult to interpret—especially in environments with dozens of concurrent BLE signals. The BLE Star Topology Visualizer simplifies this challenge by transforming complex scan results into an interactive graphical map. It offers an immediate visual representation of proximity, density, and signal strength, helping developers, testers, and engineers better understand their BLE environment at a glance. Whether it’s estimating coverage, validating signal strength, or analyzing deployment patterns, this tool bridges the gap between data and insight.
Use Cases
This visualizer can serve many real-world needs. In a smart office or industrial IoT setup, it helps pinpoint where BLE beacons or sensors are broadcasting from, enabling better device placement and coverage optimization. During security audits, it offers a quick way to detect and identify all BLE devices within range, helping spot unauthorized transmitters. In educational settings, instructors can use it to demonstrate how RSSI reflects signal strength and how Bluetooth devices advertise themselves. Additionally, developers working on new BLE-enabled hardware can use this tool for field testing, validating how their products behave under various proximity and interference conditions.
How It Works
1. BLEUIO Setup
The script utilizes BleuIO AT commands. Once connected, the script sends the following:
AT+CENTRALto switch to scanning mode.AT+SHOWRSSI=1to prepare BLEUIO to show RSSI in output.AT+GAPSCAN=5to scan for 5 seconds and return a list of advertising devices.
2. GAP Scan Output Parsing
The GAP scan output is parsed using a regex pattern that extracts:
- RSSI value
- MAC address
- Optional device name (e.g., “(HibouAIR)”)
If the same MAC appears multiple times (with and without name), the version with the name is prioritized and stored.
3. Visualization with D3.js
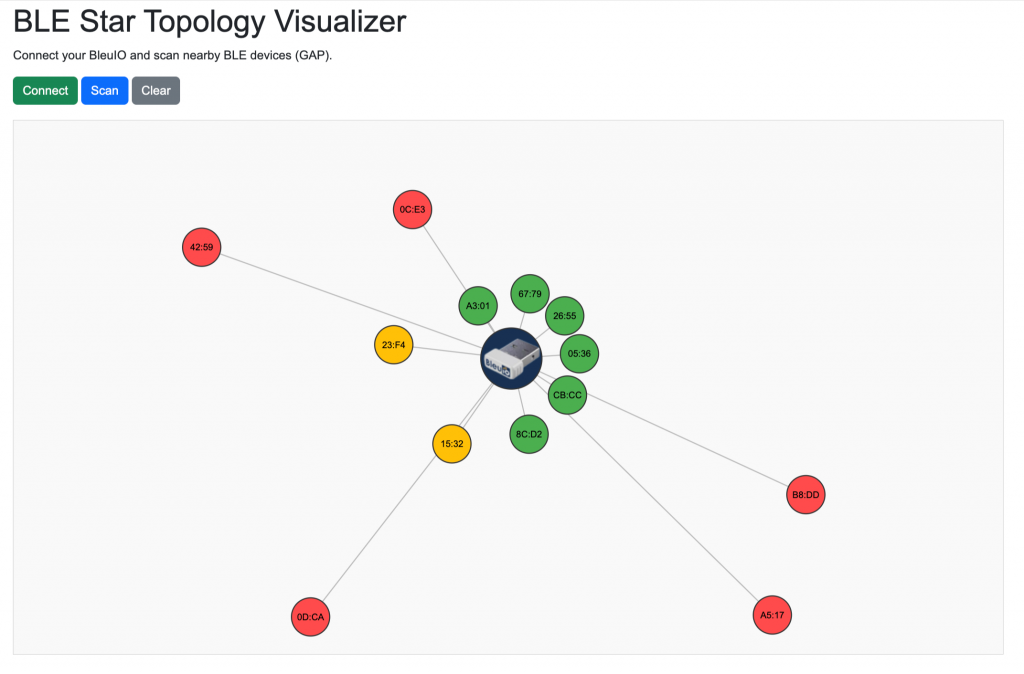
Using D3.js, the central node (BleuIO) is placed in the center. Each nearby device:
- Appears as a circle node around it.
- Is connected with a line whose length is proportional to the RSSI (inverted and scaled).
- Shows color-coded signal strength:
- Green: Strong RSSI ≥ -50
- Yellow: Medium RSSI > -70
- Red: Weak RSSI ≤ -70
A tooltip displays full device info (MAC, RSSI, and name) when hovered.
How to Try
- Plug in your BleuIO dongle.
- visit this site to access the live script https://smart-sensor-devices-ab.github.io/ble-rssi-map/
- Click Connect and allow access to the BleuIO serial port.
- Click Scan to begin GAP scan.
- Watch as nearby BLE devices are discovered and plotted dynamically.
Output
Code Access
The full script is available at Github.
The BLE Star Topology Visualizer is a powerful yet simple tool that turns your BLE scan into an interactive experience. Whether you’re debugging, teaching, or optimizing device placement, this script offers a real-time glimpse into the invisible world of Bluetooth communication.