Build a BLE RSSI Heatmap Visualizer Using BleuIO
May 22, 2026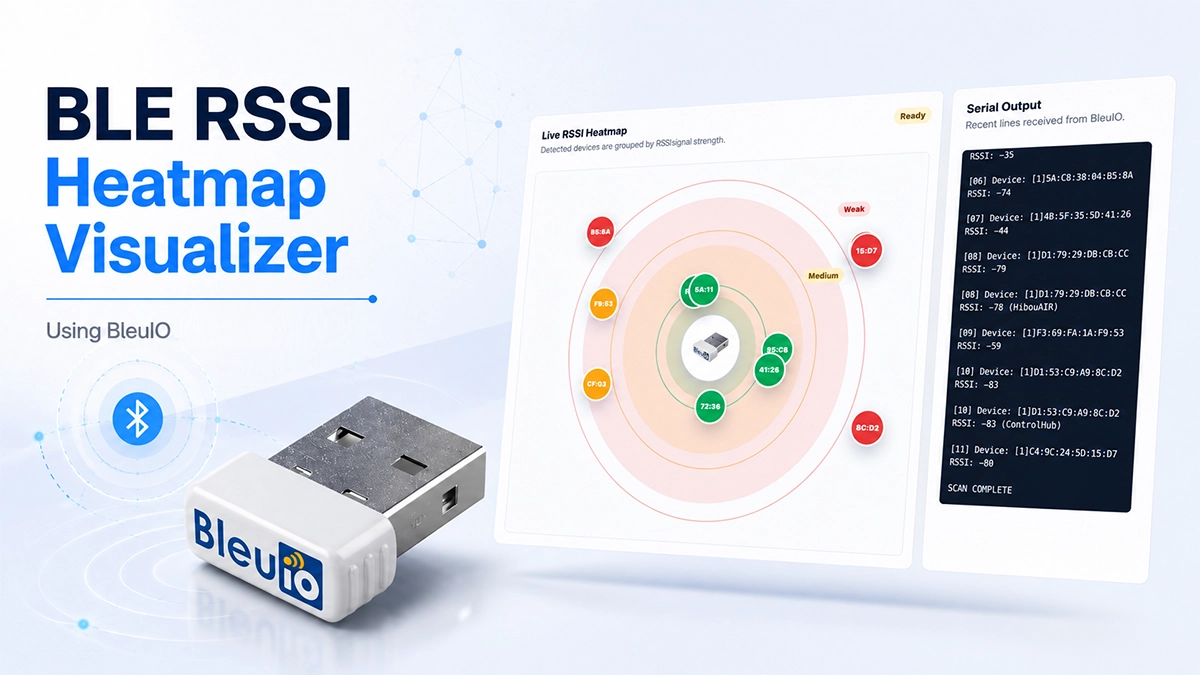
Bluetooth Low Energy devices are everywhere, from smart sensors and beacons to IoT devices and proximity-based applications. When working with BLE, developers often need a quick way to scan nearby advertising devices and understand their signal strength.
In this project, we build a simple BLE RSSI Heatmap Visualizer using the BleuIO USB dongle. The application runs directly in the browser and connects to BleuIO through the serial port. It performs a BLE scan, reads nearby advertising devices, extracts their RSSI values, and displays them in a visual heatmap.
This is helpful because raw BLE scan output can be difficult to read, especially when many devices are advertising at the same time. With this visualizer, developers can quickly see which devices have strong, medium, or weak signal strength.
BleuIO makes this project simple because it handles the BLE scanning through easy AT commands. Instead of writing low-level Bluetooth code, we can send commands from JavaScript and focus on building the visualization.
Requirements
To try this project, you need:
How It Works
The application connects to the BleuIO dongle using the browser’s Web Serial API. Once connected, it sends BleuIO AT commands to put the dongle into central scanning mode and start a BLE GAP scan.
The main commands used are:
AT+CENTRAL
AT+SHOWRSSI=1
AT+GAPSCAN=5
AT+CENTRAL prepares BleuIO for scanning. AT+SHOWRSSI=1 enables RSSI values in the scan output. AT+GAPSCAN=5 scans nearby BLE devices for 5 seconds.
The browser app then reads the serial output and looks for device information such as MAC address, RSSI value, and device name if available. Each device is grouped based on RSSI strength.
The signal categories are simple:
Strong signal: RSSI >= -50
Medium signal: RSSI between -51 and -70
Weak signal: RSSI <= -71
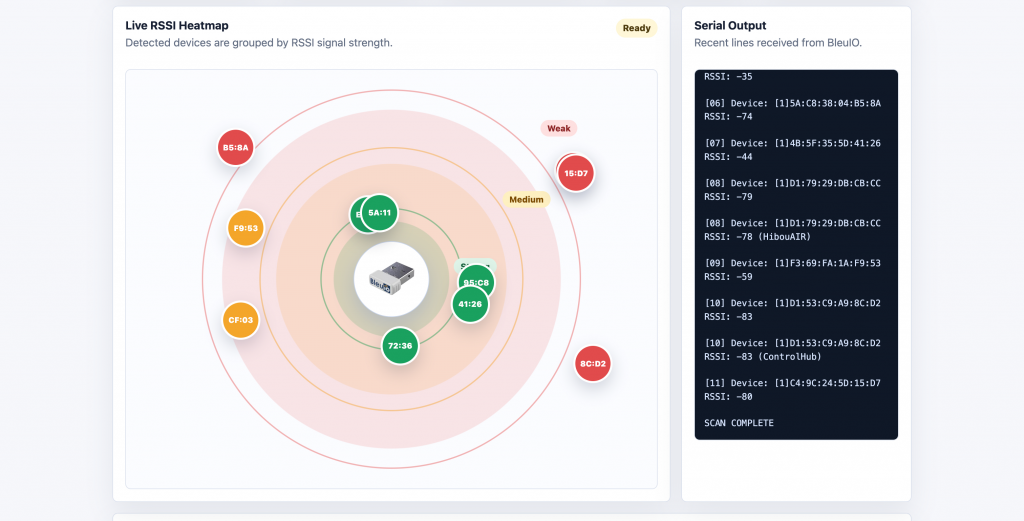
The heatmap places BleuIO at the center and displays nearby BLE devices around it. Stronger devices appear closer to the center, while weaker devices appear farther away. The device bubbles are also color-coded, making it easier to understand the BLE environment at a glance.
A table below the heatmap shows the detected devices with MAC address, RSSI, name, signal category, and last seen time.
GitHub Project Code
The full source code is available here:
https://github.com/smart-sensor-devices-ab/ble-rss-heatmap-visualizerYou can download or clone the project and open it in a supported browser.
Live Testing
You can also try the live version here:
https://smart-sensor-devices-ab.github.io/ble-rss-heatmap-visualizer/To test it:
- Plug in the BleuIO USB dongle.
- Open the live page in your browser.
- Click Connect.
- Select the BleuIO serial port.
- Click Scan.
- View the BLE RSSI heatmap and detected device table.
Output Screenshot
Add output screenshot here.
This is an example project showing how BleuIO can be used with the Web Serial API to build a practical BLE scanning and visualization tool. Developers can use the source code as a starting point and modify it for their own use cases.
For example, the project can be extended to scan for a longer period of time, change the RSSI threshold values, filter specific devices, highlight known BLE sensors, or integrate the scan results into a larger web dashboard.
Because BleuIO works with simple AT commands over serial, it is easy to integrate with different programming languages, platforms, and browser-based tools like this one.