Plotting real-time graph from Bluetooth device using C#
February 3, 2022
Bluetooth Low Energy (BLE) is a low power wireless technology used to connect devices. It is a popular communication method, especially in the Internet of Things era. Several devices around the house have a built-in Bluetooth transceiver, and most of them provide useful capabilities to automate jobs. This technology is widely used in the healthcare, fitness, beacons, security, and home entertainment industries. For that reason, it is really interesting to create a desktop application using C# that plot a real-time graph of values from HibouAir – Air Quality Monitor using BleuIO.
For this project, Bluetooth Low Energy USB dongle called BlueIO is used, which will act as a central device to retrieve data. HibouAir will serve as a peripheral device to transmit the data. The is simple to use and can be used for other purposes such as showing real-time air quality data; temperate, humidity, pressure, particle matters etc.
Let’s start
First, let’s create a new project in visual studio and select C# windows form application from the list.

Choose a suitable name for your project.
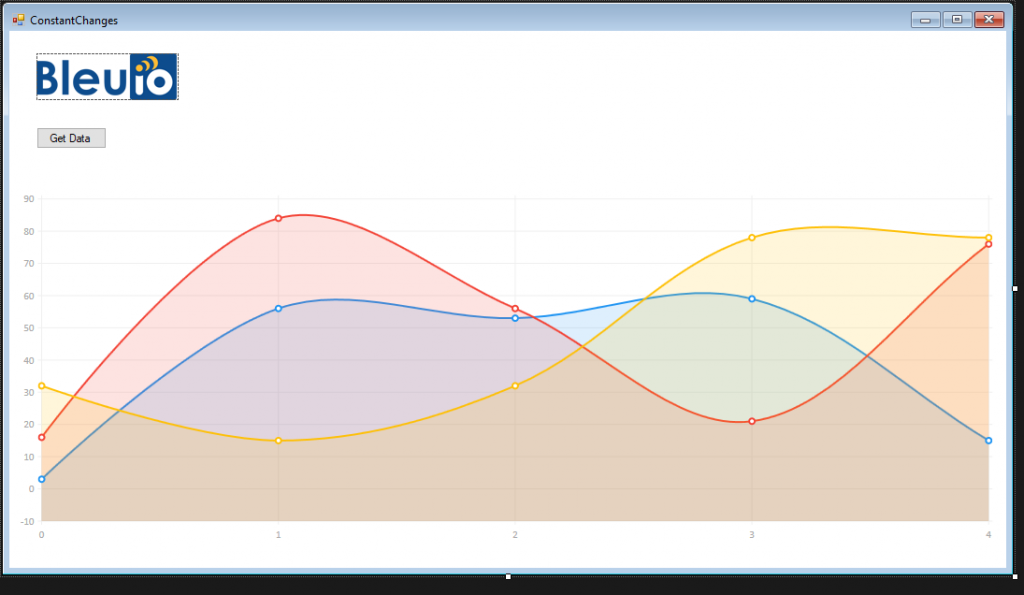
Once the project is created, we will see a blank form screen where we will add buttons and labels to communicate with BleuIO graphically and show plot real-time values from HibouAir.
The application will connect to the BleuIO dongle to its given COM port from the script. You can change the port easily by going to line number 19.
We will have a disconnect button to disconnect BleuIO from the COM port.
By clicking on the Get data button, the script will connect to The BleuIO dongle and put it on DUAL mode. Then it will look for scanned data and filter out the device advertised information that we are looking for. You can change the scanForDevice value on line number 24.
Once it starts fetching data, it will go through a parser that decodes the advertised data and returns a meaningful number.
In this script, we are only showing how to plot Ambient Light Sensor (ALS) value in lux and plot it on the chart.
The form will look like this.
The .cs file associated with this will have the following code.
Source code is available at https://github.com/smart-sensor-devices-ab/bluetooth_realtimedata_csharp
using System;
using System.Windows.Forms;
using System.IO.Ports;
using LiveCharts;
using LiveCharts.Configurations;
using LiveCharts.Wpf;
using System.Threading;
using System.Collections;
using System.Linq;
using System.Text;
using Timer = System.Windows.Forms.Timer;

namespace ConstantChanges
{
    public partial class ConstantChanges : Form
    {
        //Connect to Serial port
        //Replace port number to your comport
        SerialPort mySerialPort = new SerialPort("COM7", 57600, Parity.None, 8, StopBits.One);
        //string ScannedData = "";
        string ScannedData = "";
        bool clicked = false;

        public string scanForDevice = "5B07050345840D";
        int chartYval ;

        public String ParseSensorData(string input)
        {
            int counter = 17;
            int pressureData = Convert.ToInt32(input[counter + 9].ToString() + input[counter + 10].ToString() + input[counter + 7].ToString() + input[counter + 8].ToString(), 16);
            chartYval = pressureData;

            return pressureData.ToString();

        }
        public ConstantChanges()
        {
            InitializeComponent();
            mySerialPort.DataReceived += new SerialDataReceivedEventHandler(mySerialPort_DataReceived);
            mySerialPort.Open();
            ArrayList device = new ArrayList();
            //To handle live data easily, in this case we built a specialized type
            //the MeasureModel class, it only contains 2 properties
            //DateTime and Value
            //We need to configure LiveCharts to handle MeasureModel class
            //The next code configures MEasureModel  globally, this means
            //that livecharts learns to plot MeasureModel and will use this config every time
            //a ChartValues instance uses this type.
            //this code ideally should only run once, when application starts is reccomended.
            //you can configure series in many ways, learn more at http://lvcharts.net/App/examples/v1/wpf/Types%20and%20Configuration

            var mapper = Mappers.Xy<MeasureModel>()
                .X(model => model.DateTime.Ticks)   //use DateTime.Ticks as X
                .Y(model => model.Value);           //use the value property as Y

            //lets save the mapper globally.
            Charting.For<MeasureModel>(mapper);

            //the ChartValues property will store our values array
            ChartValues = new ChartValues<MeasureModel>();
            cartesianChart1.Series = new SeriesCollection
            {
                new LineSeries
                {
                    Values = ChartValues,
                    PointGeometrySize = 18,
                    StrokeThickness = 4
                }
            };
            cartesianChart1.AxisX.Add(new Axis
            {
                DisableAnimations = true,
                LabelFormatter = value => new System.DateTime((long)value).ToString("mm:ss"),
                Separator = new Separator
                {
                    Step = TimeSpan.FromSeconds(1).Ticks
                }
            });

            SetAxisLimits(System.DateTime.Now);

            //The next code simulates data changes every 500 ms
            Timer = new Timer
            {
                Interval = 3000
            };
            Timer.Tick += TimerOnTick;
            R = new Random();
            Timer.Start();
        }

        //Store response from the dongle
        private void mySerialPort_DataReceived(object sender, SerialDataReceivedEventArgs e)
        {

            SerialPort sp = (SerialPort)sender;
            string s = sp.ReadExisting();

            //get advertised data
            if (s.Contains("[ADV]"))
            {
                ScannedData = s;
            }

        }

        public ChartValues<MeasureModel> ChartValues { get; set; }
        public Timer Timer { get; set; }
        public Random R { get; set; }

        private void SetAxisLimits(System.DateTime now)
        {
            cartesianChart1.AxisX[0].MaxValue = now.Ticks + TimeSpan.FromSeconds(1).Ticks; // lets force the axis to be 100ms ahead
            cartesianChart1.AxisX[0].MinValue = now.Ticks - TimeSpan.FromSeconds(8).Ticks; //we only care about the last 8 seconds
        }

        private void TimerOnTick(object sender, EventArgs eventArgs)
        {
            var now = System.DateTime.Now;
            if(clicked == true) {
                getBleData();
            }

            ChartValues.Add(new MeasureModel
            {
                DateTime = now,
                //Value = R.Next(0, 10)
                Value = chartYval
            });

            SetAxisLimits(now);
            //lets only use the last 30 values
            if (ChartValues.Count > 30) ChartValues.RemoveAt(0);
        }

        private void label1_Click(object sender, EventArgs e)
        {

        }

        private void cartesianChart1_ChildChanged(object sender, System.Windows.Forms.Integration.ChildChangedEventArgs e)
        {

        }

        //Get data every 3 seconds
        private void getBleData()
        {
            var inputByte = new byte[] { 13 };
            byte[] dualCmd = Encoding.UTF8.GetBytes("AT+DUAL");
            dualCmd = dualCmd.Concat(inputByte).ToArray();
            mySerialPort.Write(dualCmd, 0, dualCmd.Length);
            Thread.Sleep(500);
            byte[] gapScanCmd = Encoding.UTF8.GetBytes("AT+FINDSCANDATA="+ scanForDevice);
            gapScanCmd = gapScanCmd.Concat(inputByte).ToArray();
            mySerialPort.Write(gapScanCmd, 0, gapScanCmd.Length);
            Thread.Sleep(1200);
            byte[] bytes = Encoding.UTF8.GetBytes("\u0003");
            bytes = bytes.Concat(inputByte).ToArray();
            mySerialPort.Write(bytes, 0, bytes.Length);

            if (ScannedData != null)
            {
                sensor_op.Text = ScannedData;
                string lastWord = ScannedData.Split(' ').Last();
                if(lastWord !=null) {
                    var toPrint = ParseSensorData(lastWord);
                    sensor_op.Text = "Current Value :" + toPrint;
                }


            }
        }


        private void btnGetData_Click(object sender, EventArgs e)
        {
            var inputByte = new byte[] { 13 };
            byte[] dualCmd = Encoding.UTF8.GetBytes("AT+DUAL");
            dualCmd = dualCmd.Concat(inputByte).ToArray();
            mySerialPort.Write(dualCmd, 0, dualCmd.Length);
            Thread.Sleep(500);
            byte[] gapScanCmd = Encoding.UTF8.GetBytes("AT+FINDSCANDATA="+ scanForDevice);
            gapScanCmd = gapScanCmd.Concat(inputByte).ToArray();
            mySerialPort.Write(gapScanCmd, 0, gapScanCmd.Length);
            Thread.Sleep(1200);
            byte[] bytes = Encoding.UTF8.GetBytes("\u0003");
            bytes = bytes.Concat(inputByte).ToArray();
            mySerialPort.Write(bytes, 0, bytes.Length);

            if (ScannedData!=null) {
                sensor_op.Text = ScannedData;
                string lastWord = ScannedData.Split(' ').Last();
                if (lastWord != null)
                {
                    var toPrint = ParseSensorData(lastWord);
                    sensor_op.Text = "Current Value :"+toPrint;
                }
                clicked = true;
            }
            //Show Chart
            cartesianChart1.Visible = true;
        }
    }
}
As you can notice, I wrote COM7 to connect to the serial port because the BleuIO device on my computer is connected to COM7.
You can check your COM port from the device manager.
Also, scanForDevice value is 5B07050345840D where 45840D is the device id.
Let’s run the project and click on Get Data. You will notice a new light value is plotting in every three seconds.
Here is a demo of this sample application.